present
سجل واحصل على خصم 50 دولارًا على مشترياتك الأولى
Trading product for Smart Trend Trading System مؤشر Supertrend Key Levels, image 1
Smart Trend Trading System
مؤشر
الإصدار 1.1، Oct 2026
Windows, Mac
Trading product for Smart Trend Trading System مؤشر Supertrend Key Levels, image 2
Trading product for Smart Trend Trading System مؤشر Supertrend Key Levels, image 3
Trading product for Smart Trend Trading System مؤشر Supertrend Key Levels, image 4
Trading product for Smart Trend Trading System مؤشر Supertrend Key Levels, image 5
Trading product for Smart Trend Trading System مؤشر Supertrend Key Levels, image 6
Trading product for Smart Trend Trading System مؤشر Supertrend Key Levels, image 7
Trading product for Smart Trend Trading System مؤشر Supertrend Key Levels, image 8
منذ 16/10/2026

الوصف

Smart Trend Trading System

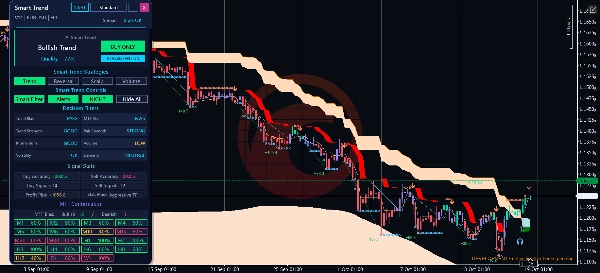
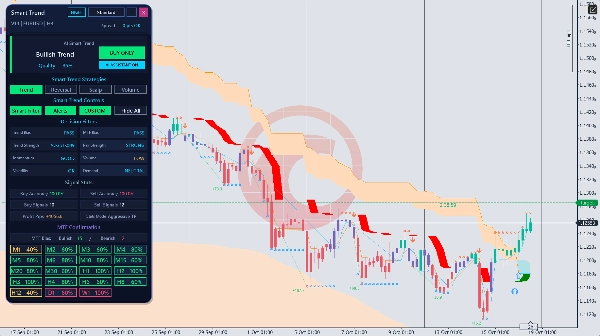
Bring trend direction, entry and exit signals, reversal zones and important price levels together on your cTrader chart. Smart Trend Trading System is an interactive indicator for traders who want to assess a setup and make their own trading decisions.

ONE SYSTEM. FOUR TRADING APPROACHES.

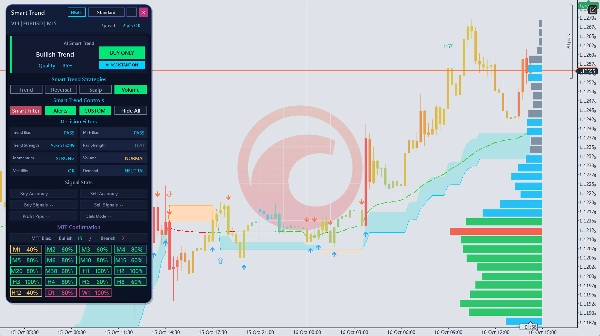
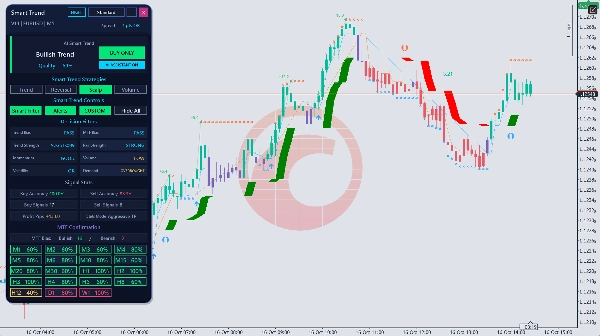
STTS organizes its trading approaches into four main categories:

• Scalping — follow shorter-term signals and market movements.

• Trend Trading — assess direction and look for opportunities within a trend.

• Reversal Trading — identify potential turning areas and changes in direction.

• Volume Trading — use volume-based information to assess market activity.

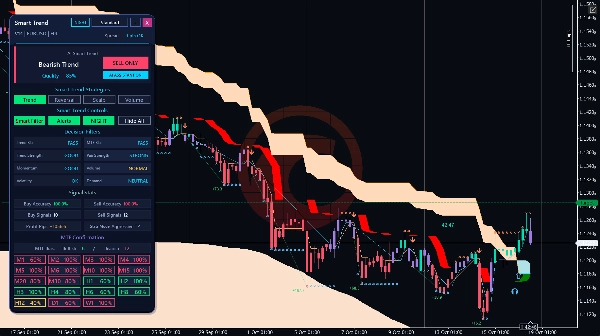
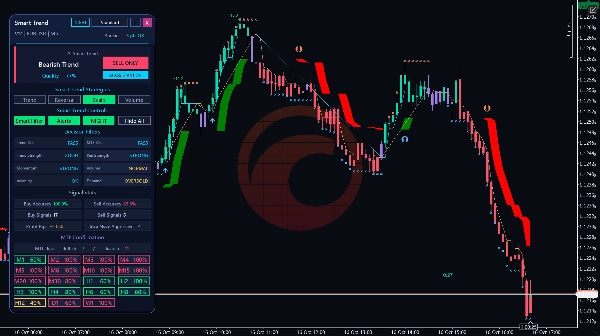
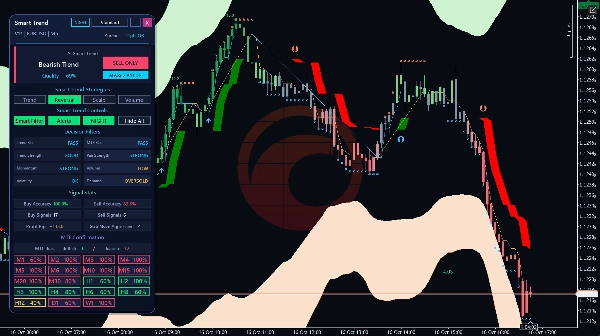
Use the on-chart panel to choose an approach, review decision filters and compare multi-timeframe confirmation. Move the panel to suit your chart layout, switch its presentation and show or hide the indicator's chart drawings as you work.

Start with one approach. Understand its signals and settings before exploring the others. A current directional assessment can differ from an older trend visible elsewhere on the chart.

USING STTS

STTS is a trend and volume indicator for manual analysis in cTrader Windows. It does not place or manage orders. EURUSD on H1 is a practical starting point used for the cTrader chart checks. The gallery compares the four approaches on M5, M15 and H1 charts. Check the selected approach and parameters against your instrument, period and broker data on a demo account before using them live.

DATA AND INTERPRETATION

Volume tools use the tick-volume data supplied by cTrader. The panel's AI Smart Trend assessment combines configured technical rules; its Quality percentage is agreement between those rules, not a probability of profit. NO DATA means the required evidence is unavailable.

SEE THE SYSTEM FOR YOURSELF

Review the on-chart signals, decision filters and multi-timeframe panel together. Panel accuracy figures, profit-pip totals and risk/reward annotations describe the indicator's analytical signal history under the selected settings. They are not account returns, a record of executed trades or a promise of future results.

— Issam Kassas, developer of Smart Trend Trading System

Trading involves risk. Past performance does not guarantee future results. Signals do not guarantee profits. Test your settings on a demo account before trading live.

الملخص

ملف تعريف المؤشر

مناقشة

تقييمات العملاء

0.0
التقييمات: 0
تقييمات العملاء
لا توجد تقييمات لهذا المنتج حتى الآن. هل جرَّبته بالفعل؟ كن أول من يخبر الآخرين!

الأسئلة الشائعة

Supertrend
Key Levels
RSI
Volume
Moving Average
VWAP
Support & Resistance
يتم توفير المنتجات المتاحة من خلال cTrader Store، بما في ذلك روبوتات التداول والمؤشرات والإضافات، من قبل مطوري الطرف الثالث وإتاحتها لأغراض الوصول المعلوماتي والفني فقط. cTrader Store ليس وسيطًا ولا يقدم نصائح استثمارية أو توصيات شخصية أو أي ضمان للأداء المستقبلي.

المزيد من هذا المؤلف

مؤشر
Volume
Order Block
+3
Map market structure, order blocks, liquidity and key zones with an interactive cTrader dashboard.

قد يعجبك أيضًا

مؤشر
Ultra-Flexible VWAP Indicator with Advanced Customization
مؤشر
Liquidity Grab
Liquidity Sweep
+1
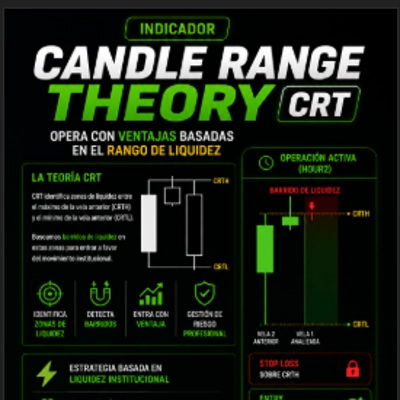
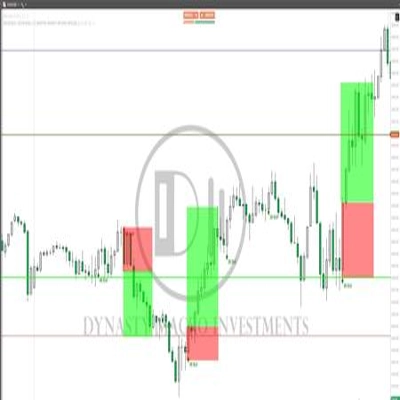
CRT Sweep Tracker is an advanced panel for Candle Range Theory (CRT) traders to track HTF sweeps and manage live trades.
مؤشر
EMA
Volume
+4
Advanced volume‑profile tool with delta, HVN/LVN zones, and precise POC‑based trade signals.
مؤشر
Shows BUY & SELL signals for 3 & 4 BAR PATTERN (Morning star/ Evening star). It is adjustable and it will SHOW ARROWS.
مؤشر
AI
Forex
+10
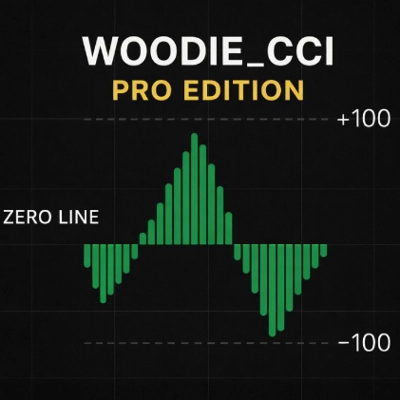
Woodie_CCI_pro is an advanced CCI-based toolkit built around the classic Woodie CCI methodology.
مؤشر
Forex
Identify 34 candlestick patterns, track trends across timeframes, and get instant alerts with this powerful trading tool
مؤشر
SMC
Prop
+15
Auto-detects Swing Highs/Lows to draw dynamic Support & Resistance levels with break tracking.
مؤشر
Volume
Key Levels
View tick activity across a selected chart range with Point of Control, Value Area High and Value Area Low.
مؤشر
SMC
Signal
+2
Gold Market Maker Zones; Non-repainting Supply & Demand detector for XAUUSD. Precise institutional zones for cTrader.
مؤشر
AI
ATR
+26
The Triple Momentum indicator for cTrader is a versatile trend-following tool.
مؤشر
Allow trader to draw multi trendlines in different timeframes on one chart,Give trader an overview of the current market
مؤشر
RSI
Signal
+3
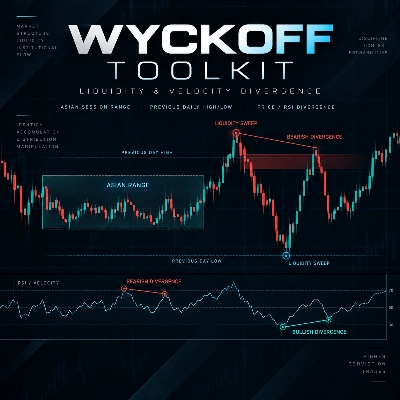
The Wyckoff Toolkit is the ultimate ally for traders seeking to decode the market through the lens of "smart money."
مؤشر
Forex
Crypto
+3
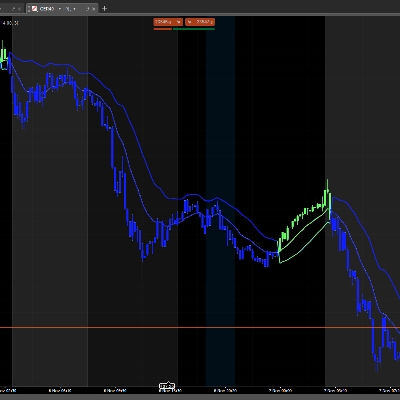
Perfect Trend
مؤشر
SMC
Prop
+12
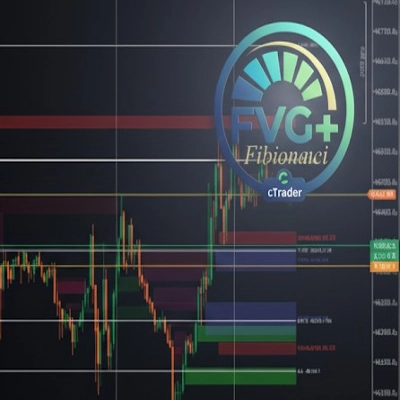
Multi-TF FVG + Smart Fibonacci
مؤشر
MSS
Volume
+3
Rejection-based volume profile with tiered heat zones, POC levels and a fully draggable anchor on cTrader.
مؤشر
Volume
Imbalance
+5
Professional OrderFlow Footprint Analysis ( Bid/ask, POC, VA, Delta, Absorption, Imbalance )
مؤشر
EMA
VWAP
+2
ORB Range Indicator maps the opening range and gives a practical session-breakout workflow with clear labels.
مؤشر
Risk Dashboard
AI-powered daily range forecasts help traders spot volatility opportunities and plan stops and targets.

السعر

منذ 16/10/2026