
مؤشر صيد الحيتان – أكاديمية بخاري
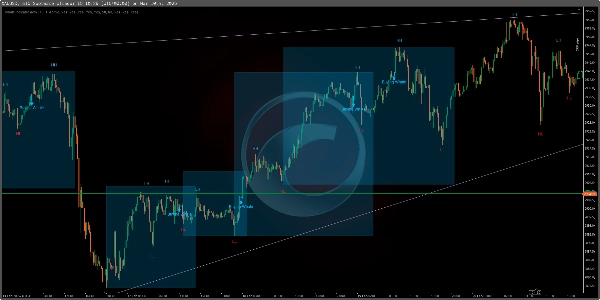
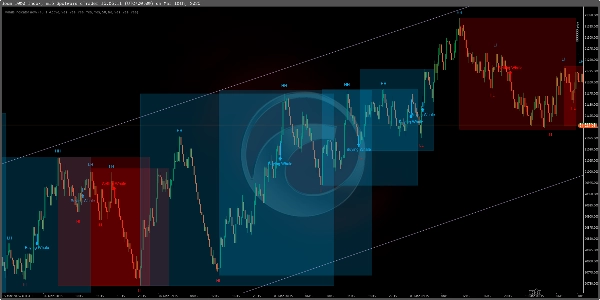
المؤشر صيد الحيتان هو أداة تداول قوية مصممة خصيصًا لمؤشرات البوم والكراش ومؤشرات التقلب. يتميز بكاشف الاتجاه التلقائي، يكتشف الاتجاهات الصاعدة والهابطة، يحدد نقاط هيكل السوق (HH, HL, LH, LL)، ويوفر إشارات شراء وبيع عالية الدقة لمساعدة المتداولين على اتخاذ قرارات مستنيرة.
الميزات الرئيسية:
✅ كاشف الاتجاه التلقائي – يحدد اتجاهات السوق تلقائيًا، مما يقلل الحاجة إلى التحليل اليدوي.
✅ مصمم لمؤشرات البوم والكراش والتقلب – مُحسّن لتداول هذه الأسواق التركيبية.
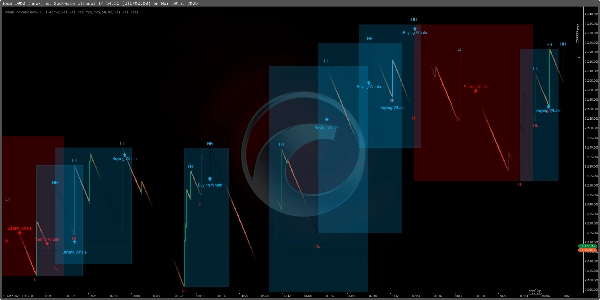
✅ كشف الارتفاعات المفاجئة على البوم والكراش (الإطار الزمني M1) – يحدد الارتفاعات المفاجئة على M1، مما يساعد المتداولين على التقاط تحركات الأسعار السريعة.
✅ تحديد الاتجاه على M15 – يعمل بفعالية على M15 لتحليل الاتجاهات العادية وترتيبات التداول المنظمة.
✅ تحليل هيكل السوق – يعرض الارتفاعات الأعلى (HH)، الانخفاضات الأعلى (HL)، الارتفاعات الأدنى (LH)، والانخفاضات الأدنى (LL) لفهم أفضل للاتجاه.
✅ إشارات دخول الحيتان – يبرز نقاط "الحوت المشتري" و"الحوت البائع" لدخول تداولات دقيقة.
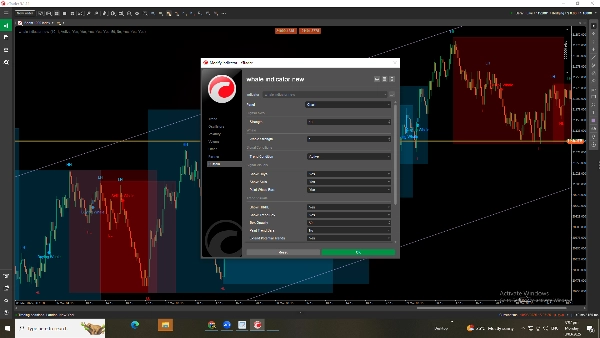
✅ إعدادات قابلة للتخصيص بالكامل – قم بضبط قوة الحوت، حساسية الإشارة، وظروف الاتجاه لتحسين نهج التداول الخاص بك.
✅ تمكين/تعطيل الميزات – قم بتبديل مربعات الاتجاه، نقاط الهيكل، وإشارات الشراء/البيع حسب الحاجة.
كيفية استخدام مؤشر صيد الحيتان؟
1️⃣ الكشف التلقائي عن الاتجاه – دع المؤشر يحدد اتجاه الاتجاه تلقائيًا.
2️⃣ تداول ارتفاعات البوم والكراش على M1 – ابحث عن إشارات على M1 لالتقاط ارتفاعات الأسعار بكفاءة.
3️⃣ تحليل اتجاهات السوق على M15 – استخدم M15 لتحليل الاتجاهات المنظمة وتأكيد التداول.
4️⃣ اتباع هيكل السوق – استخدم HH, HL, LH, LL لفهم اتجاه وقوة الاتجاه.
5️⃣ ابحث عن إشارات الحيتان – ادخل التداولات عند نقاط "الحوت المشتري" أو "الحوت البائع".
6️⃣ تخصيص للدقة – قم بضبط قوة الحوت وحساسية الإشارة لتحسين النتائج.
7️⃣ تمكين/تعطيل الميزات – عدل ظروف الاتجاه وإعدادات الهيكل حسب استراتيجيتك.
هذا المؤشر مثالي لمؤشرات البوم والكراش والتقلب، ويوفر فرص تداول عالية الاحتمالية بدقة وكفاءة. 🚀
5 | 33 % | |
4 | 67 % | |
3 | 0 % | |
2 | 0 % | |
1 | 0 % |


![شعار "Wyckoff Toolkit [Iridio Capital]"](https://cdn.ctrader.com/image/webp/8acfe6a1-6a8e-4578-9367-9df3af2b1801_27763)


