
الوصف
🎯 ذكاء التقلب متعدد الأطر الزمنية
توقف عن تفويت اختراقات التقلب - شاهد كل الإطارات الزمنية في نفس الوقت
معظم مؤشرات التقلب تظهر لك منظورًا واحدًا فقط. مؤشر التقلب المتداول متعدد الأطر الزمنية يمنحك الصورة الكاملة عبر الفترات القصيرة (7)، والمتوسطة (21)، والطويلة (63) - مع إشارات تداول مدمجة تخبرك بالضبط متى تتصرف.
⚡ لماذا يغير التقلب متعدد الأطر الزمنية كل شيء
الإطار الزمني الواحد مقابل نهجنا متعدد الأطر الزمنية:
- ❌ فترة واحدة: ترى الأشجار لكن تفوت الغابة
- ✅ ثلاث فترات: مشهد تقلب كامل مع السياق
سيناريوهات تداول حقيقية:
- ارتفاع قصير الأجل بينما الهدوء طويل الأجل → ضوضاء مؤقتة (تجاهل)
- جميع الأطر الزمنية ترتفع → تغيير نظام حقيقي (تصرف)
- هدوء قصير الأجل في وسط فوضى طويلة الأجل → هدوء زائف (حذر)
🎯 الميزات الاحترافية
✨ رؤية ثلاثية الأطر الزمنية
- الانحراف المعياري 7: التقاط تحولات التقلب الفورية (داخل اليوم)
- الانحراف المعياري 21: تقلب متوسط الأجل (تداول التأرجح)
- الانحراف المعياري 63: سياق تقلب طويل الأجل (تداول المراكز)
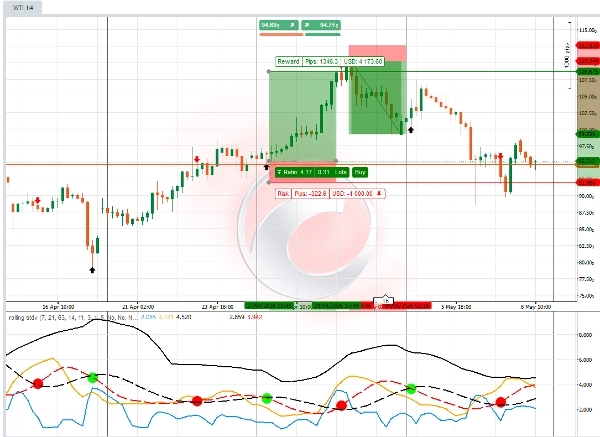
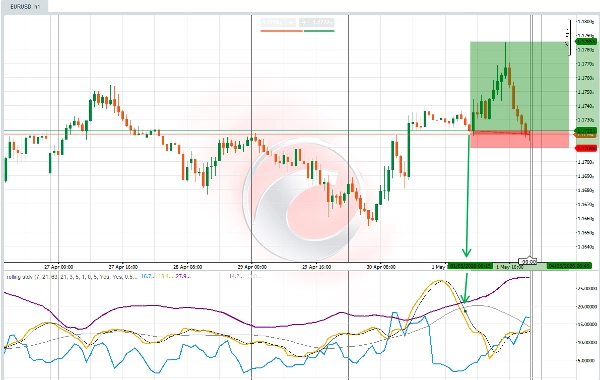
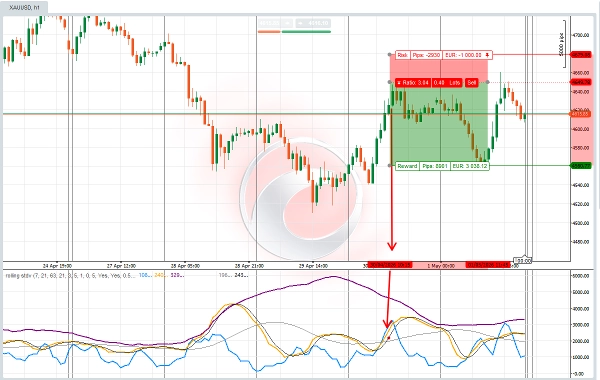
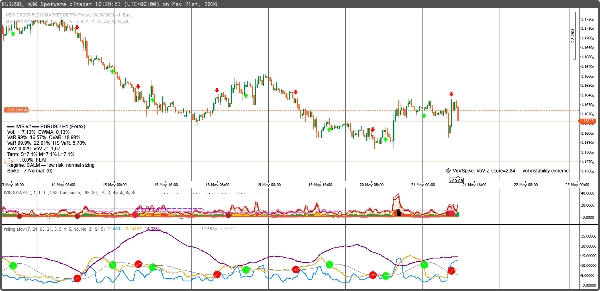
- إشارة المذبذب: عندما تتقاطع خطوط إشارة الانحراف المعياري المتداول المتوسط، النقاط الملونة تؤكد تقلبًا أعلى وأدنى واتجاه حركة السعر. مع إشارة نقطة حمراء كبيرة، ونقطة خضراء، سيرى المتداول أيضًا إشارة سهم أحمر وأخضر على الرسم البياني، والتي يمكن أن تساعد في تحديد مستويات الدخول وحجم الصفقة.
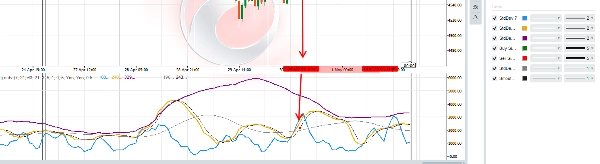
- الانحراف المعياري المتداول هو مذبذب تقلب مع منطق إشارة سوق تنبؤية. يجب فحص وتكييف المعلمات على اللوحة مع نوع أداة CFD التي يرغب المتداول في تداولها. يمكن أن يكون لكل أداة CFD للأصول المالية إعدادات مختلفة قليلاً على اللوحة. يمكن للمتداولين اختيار دقة وموثوقية قراءات التقلب، مع تفعيل: الميل، إشارة التقاطع السريع/الوسطى، والتنعيم.
📊 تحليل تقلب متقدم
- تقاطعات التقلب: تقاطع خطوط الانحراف المعياري = تغييرات النظام
- إشارات الانعكاس المتوسط: عودة التقلب إلى المتوسط
- كشف الارتفاعات المفاجئة: أحداث تقلب قصوى
💡 مثالي لأنماط التداول هذه:
🎯 متداولو اختراق التقلب
- الدخول خلال تقلب منخفض قبل التحركات الانفجارية
- الخروج خلال تقلب مرتفع قبل الانعكاسات
- توقيت الدخول بدقة باستخدام تأكيد ثلاثي
📈 متداولو الانعكاس المتوسط
- التعامل بثقة مع تقلبات متطرفة
- تحديد ظروف السوق المفرطة
- استخدام التقلب كمؤشر معاكس
🛡 المتداولون الحذرون
- تجنب فترات التقلب العالية تمامًا
- التداول فقط خلال الأسواق الهادئة والمتوقعة
- استخدام التقلب كدليل لتحديد حجم المركز
📊 متداولو الخيارات
- بيع علاوة الوقت خلال التقلب العالي
- شراء الخيارات خلال ضغط التقلب
- تحليل IV مقابل HV للتسعير الخاطئ
إشارات ذكية مدمجة:
- ✅ اشترِ عندما: ينخفض التقلب تحت العتبة أو يعبر تحت المتوسط المتحرك
- ✅ بع عندما: يرتفع التقلب فوق العتبة أو يعبر فوق المتوسط المتحرك
📈 ما ستحصل عليه:
✅ رؤية ثلاثية الأطر الزمنية - لا مزيد من التخمين في سياق التقلب
✅ إشارات شراء/بيع آلية - سهام بصرية واضحة في النقاط المثلى
✅ كشف نظام التقلب - تعرف متى تكون الأسواق هادئة أو فوضوية
✅ عتبات قابلة للتخصيص - التكيف مع أي نمط تداول أو أصل
✅ ترميز ألوان احترافي - فهم بصري فوري
💰 سعر الإطلاق الخاص: 50 دولارًا
(السعر العادي: 100 دولار)
تفصيل القيمة:
- مؤشر الانحراف المعياري 7: قيمة 29 دولارًا
- مؤشر الانحراف المعياري 21: قيمة 29 دولارًا
- مؤشر الانحراف المعياري 63: قيمة 29 دولارًا
- إشارات التداول: قيمة 49 دولارًا
- القيمة الإجمالية: 136 دولارًا
- سعرك: 50 دولارًا (وفر 35%)
المضمن: المؤشر الكامل الألوان
🎁 مكافأة: دليل توقيت التقلب المجاني
تتضمن عملية الشراء "إتقان التقلب متعدد الأطر الزمنية" - بقيمة 39 دولارًا مجانًا.
يشمل:
- استراتيجيات تداول ضغط التقلب
- تقنيات تأكيد متعدد الأطر الزمنية
- إدارة المخاطر لفترات التقلب
- أمثلة تداول من العالم الحقيقي
🚀 هل أنت مستعد لإتقان توقيت التقلب؟
انقر على "أضف إلى السلة" وحوّل طريقة رؤيتك وتداولك لتقلب السوق.
"لقد جربت كل مؤشر تقلب موجود. هذا النهج الثلاثي الأطر الزمنية مع الإشارات المدمجة هو ما أستخدمه يوميًا في تداولي بشركة التداول الخاصة بي."
- سارة رودريغيز، متداولة تأرجح محترفة
مثالي لهذه الأسواق:
📊 الأسهم وصناديق المؤشرات المتداولة
- توقيت تقلب SPY، QQQ
- تدوير القطاعات بناءً على التقلب
- ألعاب تقلب الأرباح
💹 أزواج الفوركس
- تحليل تقلب الأزواج الرئيسية
- تقييم مخاطر تداول الحمل
- تأكيد الاختراق
📈 السلع
- دورات تقلب الذهب
- ارتفاعات تقلب النفط
- تقلبات موسمية زراعية
🔄 العملات الرقمية
- أنظمة تقلب BTC/ETH
- فرص تقلب العملات البديلة
- إدارة المخاطر في العملات الرقمية
الخلاصة: هذا ليس مجرد مؤشر انحراف معياري آخر. إنه نظام توقيت تقلب كامل يظهر لك بالضبط متى ستتحرك الأسواق.
عرض الإطلاق المحدود: أول 150 نسخة بسعر 89 دولارًا (وفر 30 دولارًا)
"الفرق بين التداول الهواة والمحترفين غالبًا ما يكون في توقيت التقلب. هذا المؤشر يسد تلك الفجوة."
أضف إلى السلة الآن → ابدأ تداول التقلب كمحترف.
الملخص
Key features include:
- Triple timeframe visibility for immediate, swing, and position trading contexts.
- Volatility crossovers signaling regime shifts.
- Mean reversion and spike detection for volatility extremes.
- Customizable parameters to adapt to different CFD instruments and trading styles.
- Professional color-coded signals for quick interpretation.
This indicator suits various trading styles, including volatility breakout, mean reversion, risk-averse, and options trading. It supports multiple markets such as stocks, ETFs, forex pairs, commodities, and cryptocurrencies, providing volatility timing insights for assets like SPY, QQQ, gold, oil, BTC, and ETH.
Included with the indicator is a volatility timing guide covering compression strategies, multi-timeframe confirmation, risk management, and real trade examples. The tool requires tick data and outputs actionable signals to enhance volatility-based trading decisions.
تقييمات العملاء
5 | 50 % | |
4 | 50 % | |
3 | 0 % | |
2 | 0 % | |
1 | 0 % |


