الوصف
خريطة حرارة السيولة - تحليل المحاور متعدد الأطر الزمنية الاحترافي
حوّل تداولك باستخدام تصور السيولة المتقدم. يكشف هذا المؤشر القوي عن مناطق السيولة المؤسسية من خلال تحليل نقاط المحور عبر 10 أطر زمنية مختلفة في نفس الوقت، مما يخلق خريطة حرارة ديناميكية تظهر بالضبط مكان تموضع الأموال الذكية.
كيف يعمل
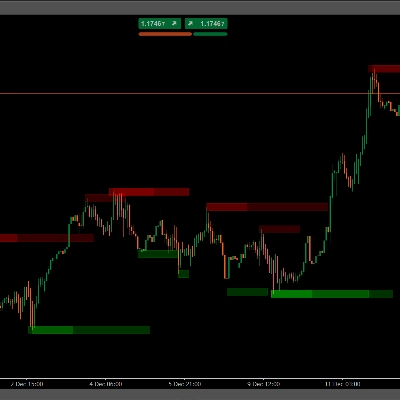
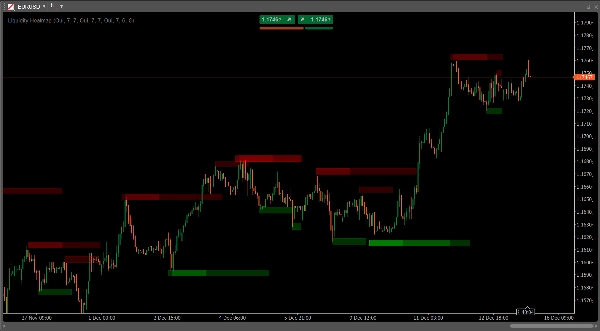
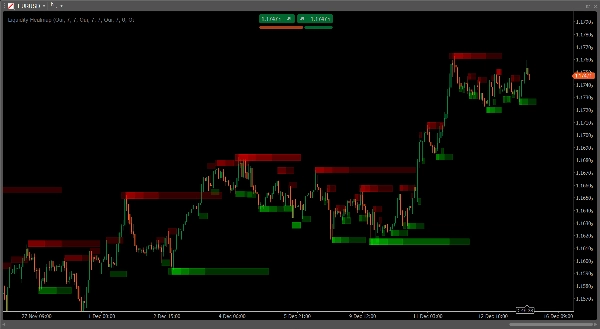
يكتشف المؤشر قمم وقيعان المحاور على أطر زمنية متعددة (15 دقيقة، 30 دقيقة، ساعة، ساعتان، 4 ساعات، يومي، 8 ساعات، 3 أيام، أسبوعي، شهري) ويضع مناطق شبه شفافة عند كل مستوى محور. حيث تتقارب عدة محاور من أطر زمنية مختلفة، تتكدس المناطق وتزداد كثافة اللون، مما يخلق "توقيع حرارة" يكشف عن أقوى مستويات السيولة على الرسم البياني الخاص بك.
الميزات الرئيسية
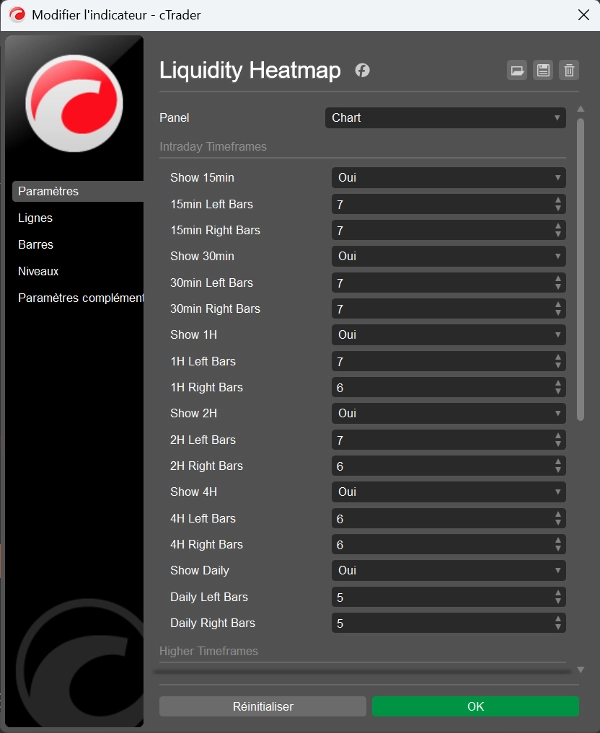
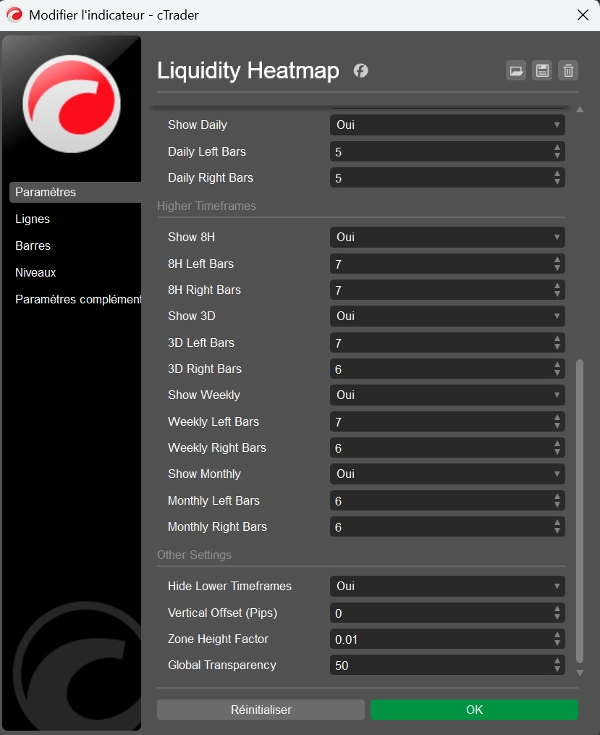
- 10 أطر زمنية قابلة للتخصيص: تحليل من منظور التداول اليومي (15 دقيقة) إلى المدى الطويل (شهري) في نفس الوقت
- رسم كثافة ذكي: المناطق المتداخلة تخلق تلقائيًا مناطق أغمق تظهر تلاقي السيولة
- كشف المحاور قابل للتعديل بالكامل: ضبط أشرطة اليسار/اليمين (2-20) لكل إطار زمني بشكل مستقل
- تصور تكيفي: ارتفاع المنطقة يتغير تلقائيًا مع تكبير الرسم البياني لمظهر متناسق
- مناطق مرتبطة بالزمن: تبقى المناطق ثابتة عند وقت تكوينها بالضبط، ولا تتحرك على الرسم البياني
- شفافية قابلة للتخصيص: تحكم في الشفافية العامة (0-255) لتناسب نمط الرسم البياني الخاص بك
- تصفية ذكية للأطر الزمنية: خيار لإخفاء الأطر الزمنية الأدنى بناءً على عرض الرسم البياني الحالي
- تحكم في الإزاحة الرأسية: ضبط دقيق لموضع المنطقة باستخدام تعديل يعتمد على النقاط
- ترميز لوني منفصل: المناطق الحمراء لقمم المحاور (المقاومة)، والخضراء لقيعان المحاور (الدعم)
مثالي لـ
- متداولي مفاهيم الأموال الذكية (SMC) الذين يحددون تجمعات السيولة
- متابعي منهجية ICT الذين يتتبعون المستويات المؤسسية
- متداولي التأرجح الذين يبحثون عن مناطق انعكاس عالية الاحتمالية
- المتداولين السريعين الذين يحددون انتزاعات السيولة داخل اليوم
- أي متداول يبحث عن تلاقي عبر أطر زمنية متعددة
تطبيقات التداول
تكشف خريطة الحرارة عن أماكن تجمع أوامر وقف الخسارة وأين من المحتمل أن تستقر الأوامر المؤسسية. استخدم هذه المناطق لـ:
- توقع مسح السيولة والانعكاسات
- تحديد تلاقيات دعم/مقاومة قوية
- العثور على نقاط دخول مثالية بعد انتزاعات السيولة
- تعيين أوامر وقف خسارة استراتيجية خلف مناطق السيولة الرئيسية
- تأكيد صحة الاختراق بمراقبة استهلاك السيولة
لماذا يبرز هذا المؤشر
على عكس مؤشرات المحاور الأساسية التي تظهر مستويات إطار زمني واحد، تجمع خريطة الحرارة هذه البيانات من 10 أطر زمنية في نفس الوقت، مما يمنحك رؤية شاملة لهياكل السوق. يظهر تصور الكثافة فورًا أي المستويات لها الأهمية الأكبر - فكلما كانت المنطقة أغمق، زاد اتفاق الأطر الزمنية على ذلك المستوى من السيولة.
محسّن للأداء
يعالج بكفاءة حتى 500 شريط لكل إطار زمني مع إدارة ذكية للكائنات، مما يضمن أداء سلس للرسم البياني حتى مع تمكين جميع الأطر الزمنية.
إعداد سهل
قم بالتثبيت وابدأ التداول فورًا مع الإعدادات الافتراضية المحسنة، أو قم بتخصيص كل معلمة لتتناسب مع استراتيجيتك وأسلوب تداولك الخاص.
ارتقِ بتحليل السيولة الخاص بك وتداول برؤية تدفق الأوامر المؤسسية. مثالي للمتداولين الذين يفهمون أن السعر لا يتحرك عشوائيًا - بل يتحرك نحو السيولة.
الملخص
Key features include customizable pivot detection parameters for each timeframe, adaptive zone visualization that scales with chart zoom, and separate color coding for resistance (red) and support (green) zones. The indicator also offers adjustable transparency, vertical offset control, and smart timeframe filtering to hide lower timeframes based on the current chart view.
This tool is suitable for traders using Smart Money Concepts, ICT methodology, swing trading, scalping, or any strategy requiring multi-timeframe liquidity analysis. It helps identify clusters of stop losses and institutional orders to anticipate liquidity sweeps, reversals, strong support/resistance levels, optimal entry points, strategic stop losses, and breakout confirmations.
Liquidity Heatmap efficiently processes up to 500 bars per timeframe with optimized object management, ensuring smooth performance. It supports various markets including Forex, Crypto, Stocks, Indices, and Commodities. The indicator comes with optimized default settings and full customization options to fit different trading styles.
تقييمات العملاء
5 | 100 % | |
4 | 0 % | |
3 | 0 % | |
2 | 0 % | |
1 | 0 % |