الوصف
خريطة حرارة Imperium MTF هي مؤشر فريد من نوعه من الدرجة الأولى لـ cTrader، تم إنشاؤه للمتداولين الذين يريدون أكثر من مجرد إشارات — إنهم يريدون السيطرة على السوق، والوضوح البصري، وقيمة تداول حقيقية.
تم تصميم هذا المؤشر لكشف الهيكل الحقيقي لحركة السوق قصيرة الأجل من خلال دمج محاذاة الأطر الزمنية المتعددة، ومنطق المتوسط المتحرك، وقوة الاتجاه، وسلوك التأكيد في نظام خريطة حرارة قوي واحد.
أكبر ميزة له ليست فقط ما يعرضه، بل مدى السرعة والوضوح في عرضه. في الأسواق السريعة، يجب اتخاذ القرارات فوراً. خريطة حرارة Imperium MTF تساعدك على تحديد الضغط الصعودي والهبوطي، وتأكيد جودة الزخم، ورصد المحاذاة عبر الطبقات الرئيسية دون ازدحام الرسم البياني بضوضاء غير ضرورية.
الإعدادات الافتراضية مُحسّنة خصيصًا لـ Tick30 و Minute1، مما يجعل هذا المؤشر ذا قيمة استثنائية للمتداولين النشطين الذين يعملون في بيئات سريعة تعتمد على الدقة. من اللحظة التي تطبقه فيها، يكون جاهزًا للعمل.
هذا مؤشر متميز ذو قوة دائمة حقيقية.
إنه نوع الأداة التي تصبح بسرعة جزءًا من روتين تداولك لأنها تمنحك معلومات يصعب تجاهلها بمجرد رؤيتها في العمل.
يتم استخدام العديد من المؤشرات لفترة ثم يتم إزالتها.
خريطة حرارة Imperium MTF مختلفة.
إنها تقدم ميزة بصرية عملية وفورية تجعلها بطبيعة الحال واحدة من تلك المؤشرات التي تعود إليها يوميًا. بمجرد أن تكون على الرسم البياني وتبدأ في قراءة السوق من خلالها، يصبح التداول بدونها وكأنك تفقد طبقة مهمة من الوعي.
إذا كنت تريد مؤشرًا فريدًا وقويًا وفعّالًا حقًا لتداول Tick30 و Minute1، خريطة حرارة Imperium MTF هو بالضبط ذلك.
كيفية استخدام خريطة حرارة Imperium MTF
خريطة حرارة Imperium MTF مصممة لمساعدتك على قراءة اتجاه السوق، وقوته، ومحاذاته بطريقة سريعة وبصرية.
بدلاً من الاعتماد على مؤشرات منفصلة متعددة، توفر لك نظرة فورية على ضغط الاتجاه عبر طبقات متعددة.
في جوهرها، يظهر المؤشر ما إذا كان السوق يميل للصعود أو الهبوط، ومدى قوة ذلك الضغط، وما إذا كانت الصفوف المختلفة متوافقة. هذا يجعل من الأسهل بكثير رصد ظروف تداول عالية الجودة وتجنب الإعدادات الضعيفة أو المزعجة.
ما تعرضه خريطة الحرارة
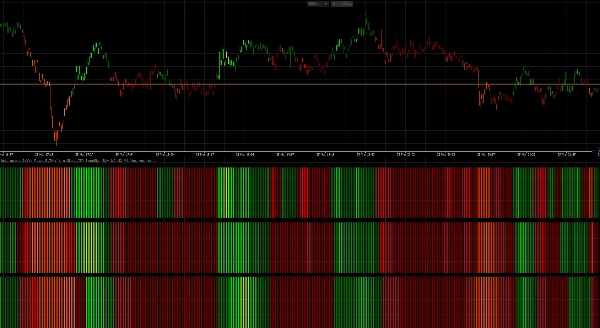
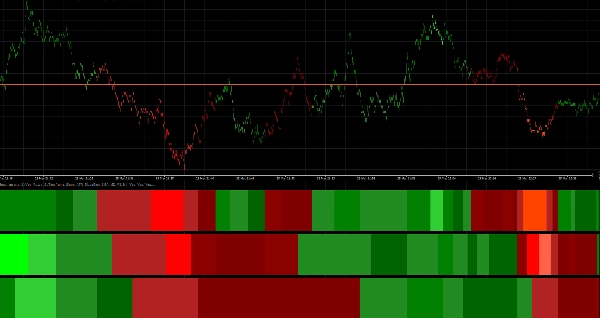
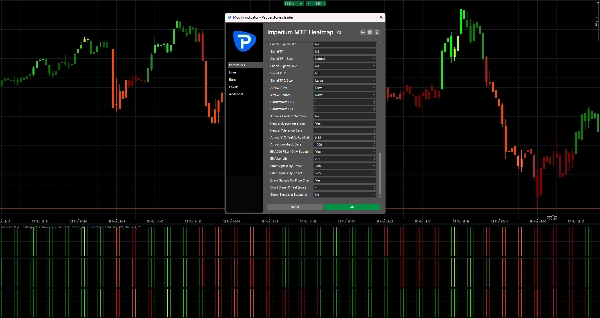
تم بناء خريطة الحرارة بـ 3 صفوف، ويمثل كل صف إطارًا زمنيًا منفصلًا أو طبقة متوسط متحرك حسب تخطيطك.
- المناطق الخضراء تشير إلى الضغط الصعودي
- المناطق الحمراء تشير إلى الضغط الهبوطي
- شدة اللون الأكثر سطوعًا / قوة تعني زخمًا أو قوة اتجاه أقوى
- الظروف الضعيفة أو غير المستقرة تظهر أقل قوة ويجب التعامل معها بحذر أكبر
عندما تتوافق عدة صفوف في نفس الاتجاه، يكون للسوق عادة هيكل أفضل وزخم أنظف.
هنا تصبح قيمة المؤشر خاصة.
الإعداد الافتراضي
الإعدادات الافتراضية مُحسّنة لـ:
- Tick30
- Minute1
هذا يعني أن المؤشر جاهز للاستخدام فورًا في بيئات التداول السريعة مثل السكالبينج والتداول اليومي قصير الأجل.
الهيكل الافتراضي:
- الصف 1 = M2
- الصف 2 = M3
- الصف 3 = M4
هذا يخلق عرضًا مضغوطًا متعدد الأطر الزمنية يساعدك على الحكم بسرعة ما إذا كان الزخم قصير الأجل مدعومًا بالطبقات التالية أعلاه.
كيفية قراءة المؤشر
1. انظر إلى الصف 1 أولاً
يعطيك الصف 1 القراءة الأسرع لاتجاه قصير الأجل والضغط الفوري.
استخدم الصف 1 للإجابة على:
- هل الزخم حاليًا صعودي أم هبوطي؟
- هل هناك ضغط نشط في السوق الآن؟
- هل الحركة قوية أم ضعيفة؟
الصف 1 هو الطبقة الأولى من المعلومات، لكنه لا يجب أن يُتداول دائمًا بمفرده.
2. استخدم الصف 2 والصف 3 للتأكيد
يعمل الصف 2 والصف 3 كمرشحات.
إذا تحول الصف 1 إلى اللون الأخضر لكن الصف 2 والصف 3 بقيا أحمر، قد تكون الحركة ضعيفة أو مبكرة أو مجرد ارتداد قصير الأجل.
إذا توافقت جميع الصفوف في نفس الاتجاه، فهذا عادة ما يشير إلى هيكل أقوى وجودة تداول أفضل.
القاعدة العامة:
- صف واحد متوافق = إشارة مبكرة
- صفان متوافقان = تأكيد أقوى
- ثلاثة صفوف متوافقة = تلاقي اتجاهي عالي الجودة
أفضل طريقة لاستخدامه في التداول
إعداد صعودي
إعداد صعودي أقوى هو عندما:
- الصف 1 أخضر
- الصف 2 أخضر
- الصف 3 أخضر
- شدة اللون صلبة أو متزايدة
- حركة السعر تدعم الاستمرار
هذا يخبرك بأن الضغط الصعودي ليس معزولًا، بل مدعوم عبر هيكل خريطة الحرارة بالكامل.
إعداد هبوطي
إعداد هبوطي أقوى هو عندما:
- الصف 1 أحمر
- الصف 2 أحمر
- الصف 3 أحمر
- شدة اللون صلبة أو متزايدة
- حركة السعر تدعم استمرار الهبوط
هذا يشير إلى سيطرة هبوطية واحتمالية أفضل للصفقات القصيرة أو تداولات الاستمرار.
نهج تداول عملي
طريقة بسيطة لاستخدام خريطة حرارة Imperium MTF:
أسلوب دخول عدواني
ادخل عندما:
- يتحول الصف 1 بقوة
- يبدأ الصف 2 بدعم الحركة
- يتزايد الزخم بسرعة
هذا الأسلوب يمنح دخولًا مبكرًا، لكنه يحمل أيضًا مخاطر أكبر.
أسلوب دخول محافظ
ادخل فقط عندما:
- الصف 1، الصف 2، والصف 3 متوافقون
- اللون مستقر وقوي
- الحركة مدعومة بحركة سعر نظيفة
هذا الأسلوب يعطي عددًا أقل من الدخول، لكنه غالبًا بجودة أفضل.
تلوين الشموع
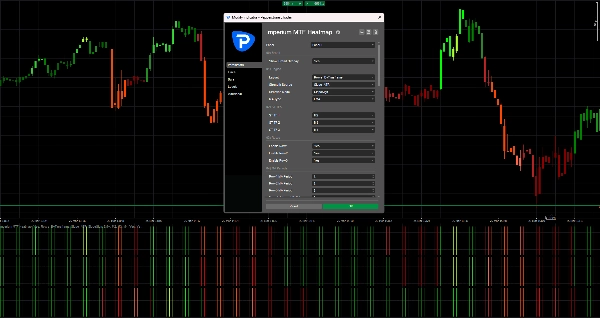
يمكن للمؤشر أيضًا تلوين الشموع بناءً على اتجاه خريطة الحرارة.
هذا يساعدك على:
- البقاء متوافقًا بصريًا مع الانحياز الحالي
- تجنب التداول ضد الضغط النشط
- قراءة السوق بشكل أسرع دون التحقق من كل صف يدويًا
مع الإعدادات الافتراضية، يرتبط تلوين الشموع بـ M2، وهو ما يتناسب جيدًا مع منطق التداول السريع في مخططات Tick30 و Minute1.
أسهم الإشارة
إذا تم تفعيلها، يمكن لأسهم الإشارة أن تساعد في تسليط الضوء على فرص الشراء والبيع المحتملة.
هذه الأسهم ليست مخصصة لاستبدال قراءة السوق.
تعمل بشكل أفضل عند استخدامها مع محاذاة خريطة الحرارة.
أفضل الممارسات:
- استخدم الأسهم فقط في اتجاه الانحياز الكامل لخريطة الحرارة
- أعطِ قيمة أكبر للأسهم عندما يؤكد الصف 2 والصف 3 الصف 1
- تجاهل الأسهم أثناء ظروف خريطة حرارة مختلطة أو متضاربة
في الإعدادات الافتراضية الحالية، تم إيقاف تشغيل أسهم الإشارة off، مما يحافظ على نظافة الرسم البياني ويركز الانتباه على خريطة الحرارة نفسها.
ما يجب تجنبه
لا تستخدم المؤشر بشكل أعمى.
تجنب الدخول في صفقات عندما:
- تكون الصفوف مختلطة
- تكون الألوان ضعيفة وغير مستقرة
- يتغير اتجاه خريطة الحرارة بسرعة
- يكون السوق متقلبًا أو محصورًا في نطاق
- تتعارض حركة السعر بوضوح مع هيكل خريطة الحرارة
يكون المؤشر أقوى عندما يُستخدم كـ أداة دعم اتخاذ القرار، وليس كنظام دخول تلقائي مستقل.
أفضل حالات الاستخدام
خريطة حرارة Imperium MTF فعالة بشكل خاص لـ:
- السكالبينج
- تداول الزخم قصير الأجل
- دخولات استمرار الاتجاه
- تأكيد الارتداد
- تحليل التلاقي متعدد الأطر الزمنية
- تصفية الصفقات الضعيفة
- البقاء متوافقًا مع ضغط السوق
لماذا يستمر المتداولون في استخدامه
يصبح هذا المؤشر قويًا لأنه يضغط الكثير من معلومات السوق المهمة في قراءة بصرية سريعة واحدة.
بمجرد أن تبدأ في استخدامه بانتظام، تبدأ في ملاحظة:
- الاتجاه بشكل أسرع
- القوة بشكل أوضح
- المحاذاة بثقة أكبر
- الإعدادات الضعيفة مبكرًا
- توقيت أفضل في الأسواق النشطة
لهذا السبب غالبًا ما يصبح واحدًا من تلك المؤشرات التي يحتفظ بها المتداولون على رسمهم البياني طوال الوقت.
قاعدة بسيطة لتتذكرها
المحاذاة الخضراء = ابحث عن عمليات شراء
المحاذاة الحمراء = ابحث عن عمليات بيع
خريطة حرارة مختلطة = انتظر
هذه القاعدة الوحيدة تجعل المؤشر عمليًا للغاية.
الملخص
Traders use the heatmap to quickly assess market direction, momentum quality, and alignment across multiple layers, aiding in identifying high-quality trade setups and filtering out weak or noisy conditions. The indicator supports both aggressive and conservative entry styles based on the alignment and strength of the heatmap rows. It can also color candles according to the dominant heatmap direction for faster market reading.
Optional signal arrows highlight potential buy and sell opportunities but are intended as a supplement to heatmap analysis rather than standalone signals. Imperium MTF Heatmap is particularly suited for scalping, short-term momentum trading, trend continuation, pullback confirmation, and multi-timeframe confluence analysis across various markets including Forex, indices, commodities, stocks, and cryptocurrencies. It functions as a decision support tool to enhance market awareness and timing in active trading environments.
تقييمات العملاء
5 | 50 % | |
4 | 50 % | |
3 | 0 % | |
2 | 0 % | |
1 | 0 % |