
WT - Tick Imbalance Bars
지표
2 구매
버전 2.0, Nov 2025
Windows, Mac
5.0
리뷰: 1
설명
TIB — 틱 불균형 바 지표. 가격 움직임 전에 시장 정보를 감지하세요
버전 2.0
자세한 내용을 문의하려면 댓글 섹션을 이용하세요
구매 후 설정 가이드가 포함된 비디오 세션 이용 가능
틱 불균형 바는 기관급 시장 미세구조 분석을 cTrader에 제공합니다. Marcos López de Prado의 획기적인 연구를 기반으로 하며, 그의 저서 Advances in Financial Machine Learning에 자세히 설명되어 있듯이, 이 지표는 시간이나 거래량이 아닌 정보 도착에 따라 가격 데이터를 샘플링합니다.
핵심 통찰
전통적인 바(시간, 틱, 거래량)는 시장을 균일하게 샘플링하여 정보에 밝은 트레이더가 행동하는 중요한 순간을 놓칩니다. 틱 불균형 바는 매수 또는 매도 압력이 예상 수준을 초과할 때를 감지하여 정보에 밝은 트레이더의 존재와 시장이 균형에 도달하기 전의 잠재적 가격 움직임을 신호합니다.
작동 원리
이 지표는 틱 규칙을 적용하여 각 거래를 매수(+1) 또는 매도(-1) 압력으로 분류합니다. 그런 다음 누적 불균형(θT)이 지수 가중 이동 평균(EWMA)을 사용해 계산된 동적 임계값을 초과할 때까지 이 부호가 있는 틱을 누적합니다. 이 예상 임계값은 매수와 매도 틱의 과거 확률을 분석하여 시장 상황에 적응합니다. 임계값이 초과되면 새로운 TIB 바가 생성되며, 각 바는 거래량이나 경과 시간과 상관없이 대략 동일한 양의 시장 정보를 포함합니다.
주요 특징
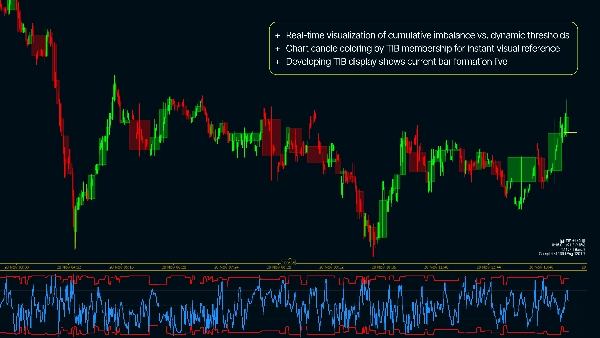
- 누적 불균형과 동적 임계값의 실시간 시각화
- 즉각적인 시각 참조를 위한 TIB 멤버십에 따른 차트 캔들 색상 표시
- 현재 바 형성을 실시간으로 보여주는 개발 중인 TIB 표시
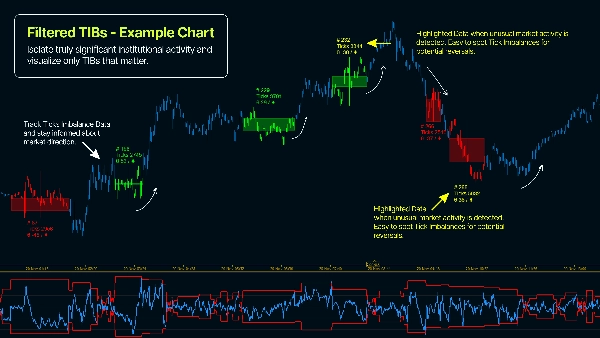
- 통계적으로 유의미한 바만 표시하는 최소 틱 필터
- 완전 구성 가능한 예상 바 크기 및 EWMA 매개변수
- 불균형 강도 및 정보 밀도를 추적하는 대시보드 지표
틱 불균형 바를 사용하는 이유?
- 정보가 많은 기간 동안 더 자주 샘플링하여 실행 가능한 변동성 포착
- 가격 균형에 도달하기 전에 정보에 밝은 거래 활동 감지
- 정보가 없는 시장 참가자 및 소매 주문 흐름의 노이즈 감소
- 시간 기반 샘플링보다 더 나은 통계적 특성(IID 가우시안 유사 수익) 달성
- 기관 트레이더가 사용하는 검증된 정량적 금융 방법론 적용
- 가격 방향의 검증된 예측자인 주문 흐름 내 비대칭 정보 식별
기본 설정을 위한 실용적 가이드 ( ! )
- 1분 타임프레임에 지표 적용 (또는 더 낮은 - 틱 기반 차트 사용)
- E[T] - 샘플링을 위한 바당 예상 틱 수 입력 (기본 1000부터 시작)
- EWMA 알파 - [0.001 - 0.5], 0.001은 가장 안정적인 결과(이론상)를, 0.5는 최신 데이터를 기반으로 한 TIB 생성
- 초기 불균형 - 권장값 0.5, 실험 가능 (0.5 = 초기화 시 중립 불균형)
요약
AI 요약
WT - Tick Imbalance Bars is an indicator for cTrader that applies institutional-grade market microstructure analysis based on the research of Marcos López de Prado. Unlike traditional bars that sample price data by time or volume, this indicator samples based on information arrival, detecting buying or selling pressure imbalances that signal informed trading activity before price equilibrium is reached.
The indicator classifies each trade as buying (+1) or selling (-1) pressure using the tick rule and accumulates these signed ticks until a dynamic threshold—calculated via an Exponentially Weighted Moving Average (EWMA)—is exceeded. When this threshold is breached, a new Tick Imbalance Bar (TIB) is formed, each containing roughly equal market information regardless of elapsed time or volume.
Key features include real-time visualization of cumulative imbalance versus dynamic thresholds, candle coloring by TIB membership, live display of the developing bar, a minimum ticks filter for statistical significance, configurable expected bar size and EWMA parameters, and dashboard metrics tracking imbalance intensity and information density.
This approach enables more frequent sampling during high-information periods, reduces noise from uninformed trades, and provides better statistical properties than time-based sampling. It supports markets including Forex, indices, and cryptocurrencies, and is suitable for strategies such as scalping and breakout trading.
지표 프로필
고객 리뷰
5.0
리뷰: 1
5 | 100 % | |
4 | 0 % | |
3 | 0 % | |
2 | 0 % | |
1 | 0 % |
고객 리뷰
November 30, 2025
WT - Tick Imbalance Bars paints a clean picture of supply/demand imbalances on tick-by-tick data. Great for scalpers and order-flow traders who want to see where traders are stepping in hard. Bars highlight strong imbalances instantly. On higher timeframes it loses noise advantage - best as a micro-timeframe tool. Alerts and stats would make it even stronger.
상담
자주 묻는 질문(FAQ)
Prop
Forex
Signal
Breakout
Scalping
Indices
Crypto
트레이딩 봇, 지표, 플러그인 등 cTrader Store에서 제공되는 상품은 제3자 개발자에 의해 제공되며, 이는 단순히 정보 및 기술적 접근을 목적으로 제공된 것입니다. cTrader Store는 중개인이 아니며, 투자 조언, 개인별 추천 또는 향후 성과에 대한 어떠한 보장도 제공하지 않습니다.
이 작성자의 상품 더 보기


가격
88.59M
거래량
105.61K
핍 수익
75
판매
457
무료 설치