
설명
이 지표는 위험 관리 도구입니다. 세부 사항은 다음과 같습니다:
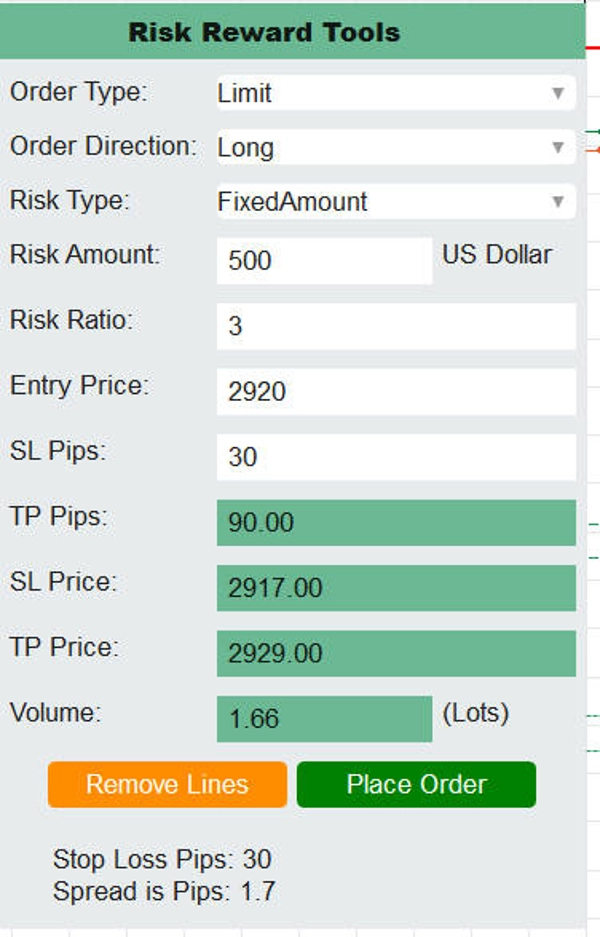
1) 주문 유형: 지정가 주문, 시장가 주문, 스톱 주문;
2) 위험 방법: 고정 금액 (예: $200, 사용자가 입력 가능), 계좌 잔액의 백분율 (예: 1%, 사용자가 입력 가능);
3) 위험-보상 비율: 사용자가 이 값을 입력할 수 있으며, 예를 들어 세 배의 수익. 시스템은 설정된 값을 기반으로 거래 가능한 로트 크기, 진입 가격, 손절 핍 및 가격, 이익 실현 핍 및 가격을 자동으로 계산합니다;
4) 진입 가격: 현재 종목의 현재 가격이 기본값이며, 사용자가 수정하고 수동으로 입력할 수 있습니다;
5) 손절 핍: 기본값은 10 * 심볼 스프레드 (사용자가 수정하고 수동으로 입력 가능);
6) 로트 크기: 자동으로 계산됨;
7) 이익 실현: 자동으로 계산됨 (핍과 가격 포함);
8) 손절 가격: 자동으로 계산됨.
인터페이스 하단에는 위의 매개변수 설정을 기반으로 주문 실행 작업을 수행하는 "주문하기" 버튼이 있습니다.
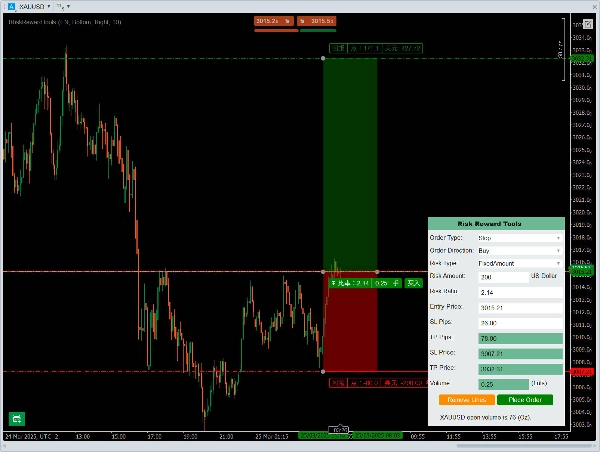
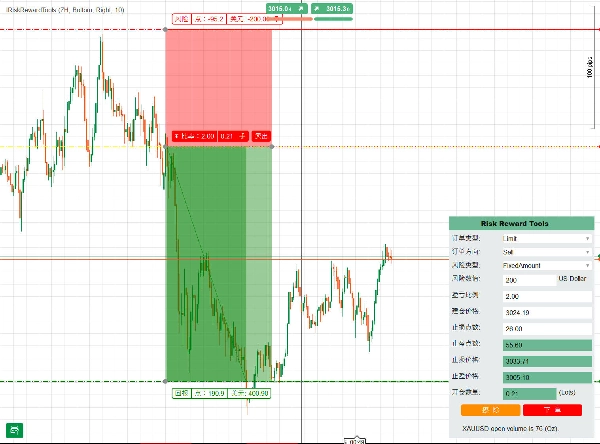
먼저, 이 지표는 위험 관리 도구이며, 사용자 인터페이스에는 드롭다운 메뉴, 텍스트 박스, 버튼과 같은 다양한 입력 컨트롤이 있어 주문의 로트 수, 손절, 이익 실현 등의 매개변수를 계산합니다. 사용자는 주문 유형(지정가, 시장가, 스톱), 방향(매수/매도), 위험 유형(고정 금액 또는 백분율)을 선택하고, 위험 값, 위험-보상 비율, 진입 가격을 입력한 후 해당 손절 가격, 이익 실현 핍 및 가격, 로트 수를 계산하며 주문 기능을 제공합니다. 설명은 다음과 같습니다:
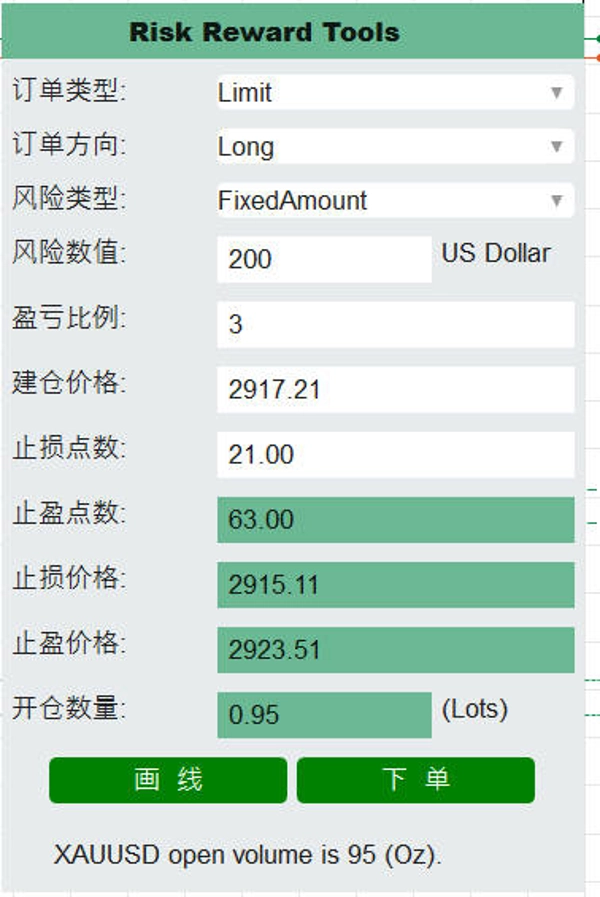
1) 주문 유형:지정가 주문, 시장가 주문, 스톱 주문:
2) 위험 방식:고정 금액(예: 200달러, 사용자가 입력 가능), 계좌 잔액 백분율(예: 1%, 사용자가 입력 가능);
3) 손익 비율:사용자가 직접 입력할 수 있으며, 예를 들어 3배. 시스템은 설정된 값을 기준으로 자동으로 개시 가능한 로트 수, 진입 가격, 손절 핍 및 가격, 이익 실현 핍 및 가격을 계산합니다;
4) 진입 가격:기본값은 현재 종목의 현재 가격이며, 사용자가 직접 수정하여 입력할 수 있습니다;
5) 손절 핍:손절 핍을 입력하면 개시 가능한 로트 수, 손절 가격, 이익 실현 가격 등의 정보가 자동으로 계산되며, 차트에서 선 그리기 기능을 통해 관련 위치 정보를 확인할 수 있습니다;
6) 개시 로트 수:자동 계산;
6) 이익 실현:자동 계산(핍과 가격 포함);
7) 손절:자동 계산(핍과 가격 포함).
인터페이스 가장 아래에는 "주문하기" 버튼이 있어 위 매개변수 설정에 따른 주문 실행 작업을 수행합니다. 동영상 소개를 참조하세요:


!["Wyckoff Toolkit [Iridio Capital]" 로고](https://cdn.ctrader.com/image/webp/8acfe6a1-6a8e-4578-9367-9df3af2b1801_27763)


!["Gaussian Channel [Iridio Capital]" 로고](https://cdn.ctrader.com/image/webp/7c039209-5573-4a54-a072-f9528b503103_41960)


