
설명
히트맵 유동성 구역
가격대별 거래량을 시각화하고, 숨겨진 지지/저항을 발견하며, 실시간으로 시장 유동성을 추적하세요.
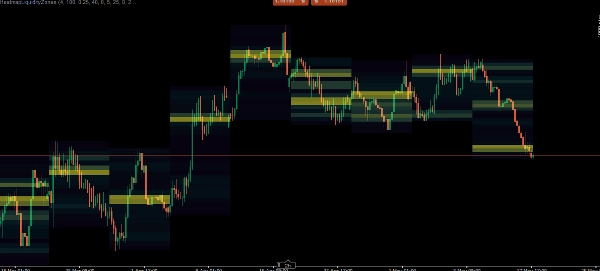
히트맵 유동성 구역 지표는 원시 시장 데이터를 직관적인 시각적 히트맵으로 변환하는 강력한 거래량 프로파일링 도구입니다. 특정 고시간 프레임(HTF)에서 틱 거래량을 분석하여 가장 중요한 매수 및 매도 압력이 집중된 위치를 정확히 식별합니다.
시장이 어디서 반전할지 추측하는 대신, 이 지표는 정확하고 거래량에 기반한 유동성 수준을 표시합니다. 이 수준들은 동적으로 앞으로 확장되며, 가격이 이를 돌파하고 무효화하면 자동으로 사라져 차트를 깔끔하고 현재 가격 움직임에 엄격히 관련되도록 유지합니다.
주요 특징
다중 시간 프레임 히트맵: 선호하는 매크로 시간 프레임(1시간, 4시간, 일간, 주간 또는 월간)을 선택하세요. 지표는 해당 기간의 거래량 분포를 하위 시간 프레임 차트에 직접 매핑합니다.
동적 ATR 구간화: 가격 스케일은 평균 진폭 범위(ATR)를 사용해 계산된 동적 "구간"(영역)으로 나뉩니다. 이는 히트맵이 변동성이 큰 시장과 긴밀히 통합되는 시장 모두에 지능적으로 적응하도록 보장합니다.
자동 무효화 유동성 수준: 특정 가격 구간에 대량의 거래량이 쌓이면 "유동성 수준"이 됩니다. 지표는 미래로 확장되는 실선으로 이를 표시합니다. 가격이 이 수준을 성공적으로 돌파하면 선은 자동으로 제거(무효화)됩니다.
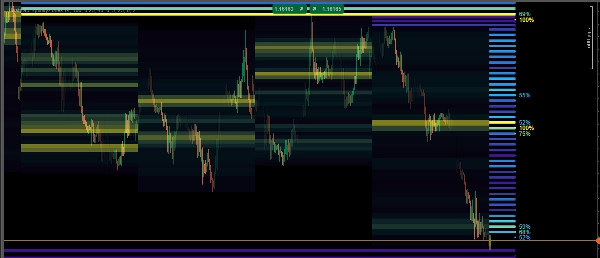
밀도 그라데이션 색상: 낮음, 중간, 높음 거래량 노드를 시각적으로 구분합니다. 히트맵은 가장 무거운 거래량이 어디에 집중되어 있는지 정확히 보여주기 위해 색상 그라데이션을 사용합니다.
백분율 추적: 고밀도 유동성 수준은 백분율 라벨(예: 85%)을 표시하여 해당 노드가 HTF 기간의 나머지 거래량에 비해 얼마나 강한지 정확히 보여줍니다.
요약
The indicator segments the price scale into dynamic zones based on the Average True Range (ATR), adapting to market volatility. It highlights significant volume clusters as liquidity levels with solid lines extending forward. These lines automatically disappear if the price breaks through the level, ensuring the chart remains focused on relevant, current price action.
A color gradient visually distinguishes low, medium, and high volume nodes, while percentage labels indicate the relative strength of high-density liquidity levels within the chosen timeframe. This tool supports traders in tracking market liquidity in real-time and making volume-backed decisions regarding support and resistance areas.
고객 리뷰
5 | 100 % | |
4 | 0 % | |
3 | 0 % | |
2 | 0 % | |
1 | 0 % |


