
ORB_BRSTrading
インジケーター
1 購入済
バージョン 1.0、Nov 2025
Windows、Mac
4.6
レビュー: 3
説明
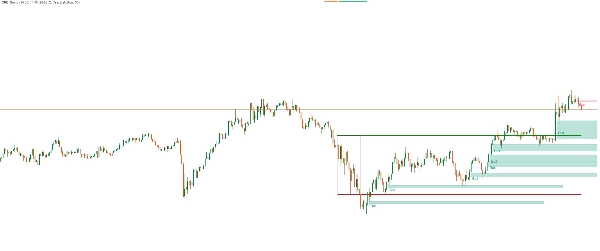
このインジケーターは、オープニングレンジブレイクアウト(ORB)トレーディング戦略を実装しており、取引セッションの最もボラティリティの高い期間中のモメンタムを捉えることを目的としています。ユーザー定義の時間パラメーターに基づいてオープニングレンジを特定し、潜在的なエントリーシグナルのためのブレイクアウトレベルをプロットします。この戦略は、市場が初期レンジの上または下を突破したときの価格変動を利用し、しばしば強い方向性トレンドを示します。
主な特徴:
- カスタマイズ可能なオープニングレンジの時間ウィンドウ
- ブレイクアウトレベルの自動計算
- ブレイクアウト確認のための視覚的アラート
- 複数のタイムフレームおよび銘柄で動作
- 高確率のセットアップを求める日中トレーダーに最適
仕組み:
- 指定された期間のオープニングレンジ(高値と安値)を定義します。
- このレンジを超えるブレイクアウトの価格動向を監視します。
- ブレイクアウトの方向とオプションのフィルター(例:出来高、ボラティリティ)に基づいて取引シグナルを生成します。
概要
AIによる概要
ORB_BRSTrading is an indicator implementing an Opening Range Breakout (ORB) trading strategy aimed at capturing momentum during the most volatile period of a trading session. It defines the opening range high and low based on user-specified time parameters and automatically calculates breakout levels. The indicator monitors price action for breakouts beyond this range and generates trade signals according to breakout direction, with optional filters such as volume or volatility. It provides visual alerts to confirm breakouts and supports multiple timeframes and instruments, making it suitable for intraday traders seeking high-probability setups. The strategy is applicable across various markets including Forex, stocks, indices, and symbols like BTCUSD, EURUSD, GBPUSD, XAUUSD, NAS100, and USDJPY.
インジケーターのプロフィール
カスタマーレビュー
4.6
レビュー: 3
5 | 67 % | |
4 | 33 % | |
3 | 0 % | |
2 | 0 % | |
1 | 0 % |
カスタマーレビュー
February 9, 2026
ORB_BRSTrading is a solid Opening Range Breakout tool. Clean visuals and reliable logic make it work best on M10-H4. Great for intraday and session-based breakout strategies. Less effective on very low or very high timeframes.
December 10, 2025
December 2, 2025
ディスカッション
よくあるご質問
BTCUSD
Forex
Breakout
Indices
EURUSD
GBPUSD
NZDUSD
Stocks
XAUUSD
NAS100
USDJPY
cTrader Storeで入手可能な取引ボット、インジケーター、プラグインなどの商品は、第三者の開発者が提供するものであり、情報と技術の取得のみを目的としてご利用いただけます。cTrader Storeはブローカーではなく、投資助言や個人的な推奨を行うことも、将来のパフォーマンスを保証することもありません。
この作成者の他の商品

これも好きかも


価格
登録日 22/10/2025
303.42M
取引数量
49
獲得pips
1
販売