
Fixed Range Volume Profile
Indicador
2 compras
Versión 1.0, Jan 2026
Windows, Mac
4.0
Valoraciones: 2
Descripción
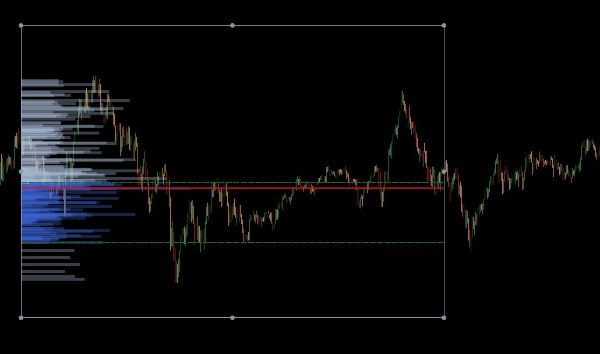
Cómo usar el Perfil de Volumen de Rango Fijo (FRVP)
- Activar el Indicador: Arrastra y suelta el Indicador FRVP en el gráfico deseado desde el menú de cTrader Automate o Indicadores.
- Seleccionar la Herramienta de Análisis: Ubica la Herramienta de Dibujo de Rectángulo estándar en la barra de herramientas de cTrader (normalmente en el lado derecho o izquierdo de la plataforma).
- Definir tu Rango: Haz clic y arrastra el rectángulo sobre la acción de precio y el período de tiempo específicos que deseas analizar.
- Inicializar el Perfil: Después de dibujar, haz clic y mueve ligeramente el rectángulo. Este "apretón de manos" entre el dibujo y el indicador activa el cálculo de volumen, generando instantáneamente el histograma, POC y las líneas del Área de Valor.
- Ajustar Dinámicamente: Puedes arrastrar los bordes del rectángulo para ampliar el rango de tiempo o moverlo a una pierna de precio diferente; el perfil de volumen se recalculará automáticamente para reflejar la nueva área.
El Perfil de Volumen de Rango Fijo (FRVP) para cTrader es una herramienta de análisis sofisticada diseñada para identificar niveles de precio significativos calculando la distribución del volumen sobre un rango específico de tiempo y precio. A diferencia de los indicadores de volumen estándar que corresponden al tiempo, este indicador se centra en la densidad de precio para revelar el sentimiento del mercado.
Características Principales
- Selección Dinámica de Rango: El indicador calcula y actualiza automáticamente cada vez que dibujas o mueves un rectángulo estándar en tu gráfico de cTrader.
- Identificación de Niveles Clave:
-
- Punto de Control (POC): Destaca el nivel de precio con el mayor volumen negociado, actuando como un "imán" para la acción del precio.
- Alto/Bajo del Área de Valor (VAH/VAL): Define los límites donde se negoció un porcentaje específico de volumen (por defecto 40%).
- Diseños Personalizables:
-
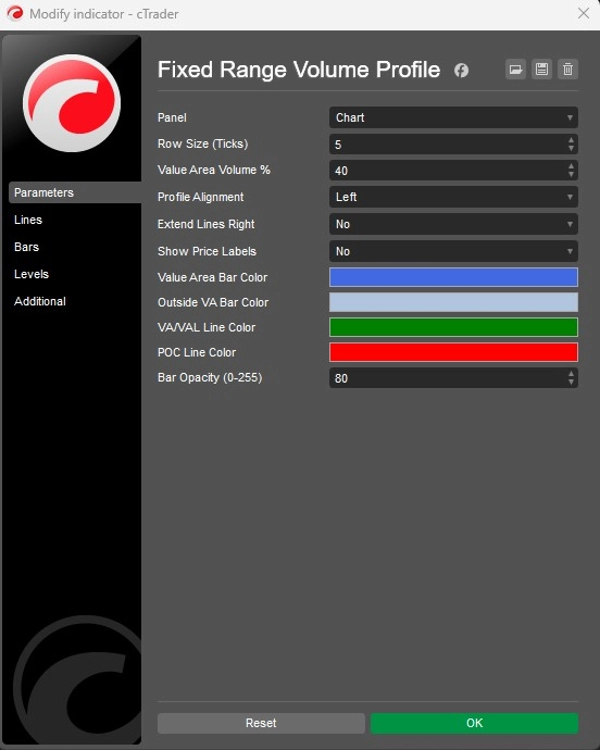
- Alineación: Elige mostrar el histograma de volumen desde el Lado Izquierdo o el Lado Derecho de la caja.
- Granularidad: Ajusta el Tamaño de Fila (por defecto 5 ticks) para controlar el detalle de las barras de volumen.
- Visuales: Control total sobre los colores de las barras (Área de Valor vs. Exterior), opacidad y visibilidad de la etiqueta de precio.
Aplicación Estratégica
- Soporte y Resistencia: Los Nodos de Alto Volumen (HVN) a menudo actúan como soporte o resistencia fuerte, mientras que los Nodos de Bajo Volumen (LVN) representan áreas "delgadas" donde el precio puede moverse rápidamente.
- Confirmación de Tendencia: Usa la función Extender a la Derecha para ver cómo los niveles históricos de volumen interactúan con la acción del precio actual a medida que se desarrolla.
Resumen
Resumen de IA
The Fixed Range Volume Profile (FRVP) indicator for cTrader analyzes volume distribution within a user-defined price and time range using a standard rectangle drawing tool. By selecting and adjusting this rectangle on the chart, the indicator dynamically calculates and displays a volume histogram along with key levels: Point of Control (POC), which marks the price with the highest traded volume, and Value Area High/Low (VAH/VAL), defining the volume concentration boundaries. Users can customize the histogram’s alignment, granularity (row size), colors, opacity, and price label visibility. The indicator supports dynamic range adjustments by dragging the rectangle edges, automatically recalculating volume data. Strategically, it helps identify support and resistance zones through high and low volume nodes and offers trend confirmation by extending volume levels into current price action. The FRVP is applicable across various markets including Forex, cryptocurrencies, commodities, indices, and stocks, and supports symbols such as BTCUSD, EURUSD, GBPUSD, XAUUSD, and NAS100. It integrates with cTrader’s drawing tools and provides a detailed volume-based perspective on price action beyond standard time-based volume indicators.
Perfil del indicador
Valoraciones de clientes
4.0
Valoraciones: 2
5 | 0 % | |
4 | 100 % | |
3 | 0 % | |
2 | 0 % | |
1 | 0 % |
Conversación
Preguntas frecuentes
BTCUSD
Forex
Signal
Breakout
Indices
EURUSD
Commodities
GBPUSD
NZDUSD
Fibonacci
Prop
Scalping
Fair Value Gap
SMC
Crypto
Stocks
XAUUSD
NAS100
USDJPY
VWAP
Los productos disponibles a través de cTrader Store, incluidos bots, indicadores y plugins para operar, son proporcionados por desarrolladores de terceros y están disponibles únicamente con fines informativos y de acceso técnico. cTrader Store no es un bróker, por lo que no proporciona asesoramiento de inversión, recomendaciones personales ni ninguna garantía de rentabilidad futura.
Más de este autor


Precio
Desde 26/09/2025
13
Ventas