
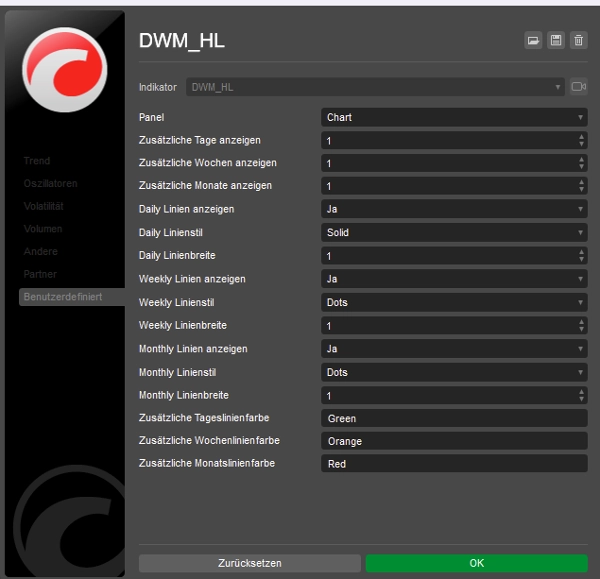
Daily Weekly Monthly - Highs & Lows
インジケーター
5 購入済
バージョン 1.0、Sep 2024
Windows、Mac
5.0
レビュー: 2
説明
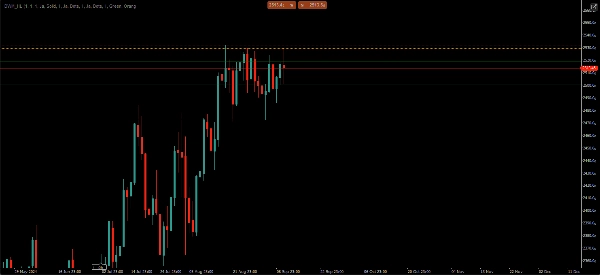
NGS流動性レベル – 日次・週次・月次の高値&安値
ランダムなラインではなく、流動性の周りで取引しましょう。
NGS流動性レベルは、すべてのチャートに最も重要な日次、週次、月次の流動性レベルを自動的に表示します。
• 手動での描画不要
• タイムフレームの切り替え不要
• チャートの乱雑さなし
このユーザーフレンドリーなインジケーターは、トレーダーが数秒で重要な流動性および市場構造のレベルを特定するのに役立ちます。毎日高値と安値を手動でマークする代わりに、最も重要なレベルが自動的に表示され、更新されます。
特徴:
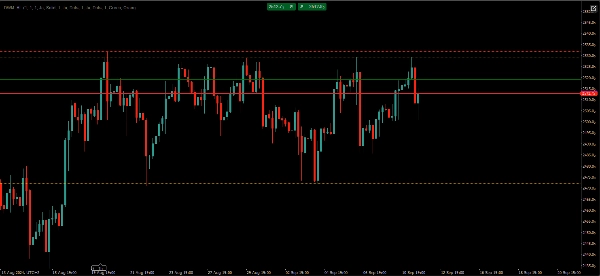
• 自動の日次高値&安値レベル
• 自動の週次高値&安値レベル
• 自動の月次高値&安値レベル
• オプションで前期間のレベル表示
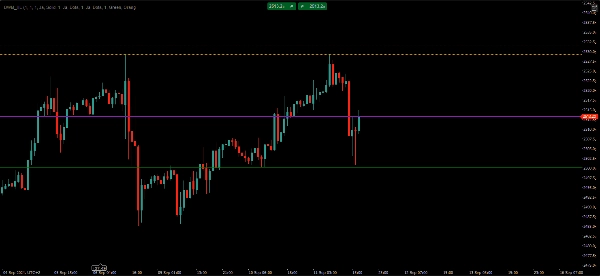
• カラーとラインスタイルのカスタマイズ可能
• クリーンで軽量なチャート表示
• 外国為替、指数、商品、暗号通貨に対応
• 複数のタイムフレームをサポート
• 再描画なし
市場構造、流動性、および上位タイムフレームのレベルに焦点を当てるトレーダー向けに設計されています。
シグナルなし。
戦略なし。
利益の約束なし。
ただ客観的な流動性レベルとよりクリーンな取引ワークフロー。
概要
AIによる概要
The Daily Weekly Monthly - Highs & Lows indicator automatically displays key high and low price levels from the most recent and previous daily, weekly, and monthly periods on trading charts. It supports multiple timeframes and markets including Forex, Indices, Commodities, Stocks, and Crypto. Users can customize line colors and styles for each period to maintain a clean, uncluttered chart layout. This indicator provides a clear visual representation of important liquidity and market structure levels, aiding traders in identifying crucial support and resistance zones without manual drawing or timeframe switching. It is non-repainting and designed for objective analysis without signals or trading strategies.
インジケーターのプロフィール
インジケーターのカテゴリー
サポート&レジスタンス
出力の種類
ビジュアル表示
データ要件
バーのみ
カスタマーレビュー
5.0
レビュー: 2
5 | 100 % | |
4 | 0 % | |
3 | 0 % | |
2 | 0 % | |
1 | 0 % |
カスタマーレビュー
September 18, 2024
A 5 minute check should not become a 30 minute rabbit hole, and the process is easier to respect.
September 16, 2024
A week of notes gives a better read, and the routine feels easier to keep.
ディスカッション
よくあるご質問
BTCUSD
Forex
Indices
Commodities
Stocks
XAUUSD
Support & Resistance
cTrader Storeで入手可能な取引ボット、インジケーター、プラグインなどの商品は、第三者の開発者が提供するものであり、情報と技術の取得のみを目的としてご利用いただけます。cTrader Storeはブローカーではなく、投資助言や個人的な推奨を行うことも、将来のパフォーマンスを保証することもありません。
この作成者の他の商品


![「Gaussian Channel [Iridio Capital]」ロゴ](https://cdn.ctrader.com/image/webp/7c039209-5573-4a54-a072-f9528b503103_41960)


価格
登録日 11/09/2024
7
販売