


説明
📊 マネーフロープロファイル
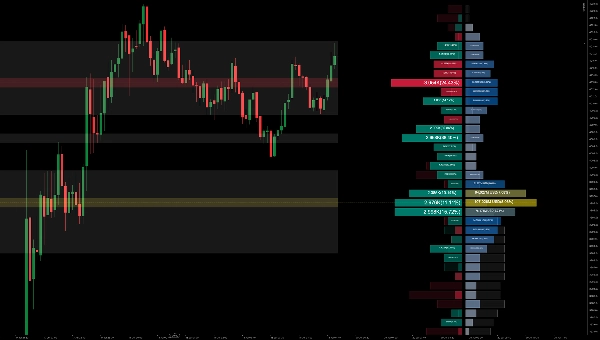
マネーフロープロファイルは、高度なチャートツールで、指定された期間内の市場のすべての価格レベルでの取引量またはマネーフローを測定します。資産の価格とトレーダーの買いまたは売りの意欲との関係を強調し、以下を可能にします:
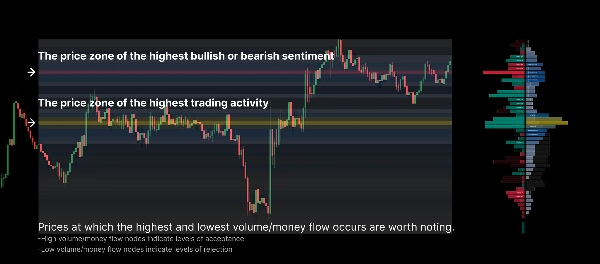
- 重要な価格レベルの明示:取引量のクラスターやポイント・オブ・コントロール(POC)などの高流動性ノードを簡単に特定します。
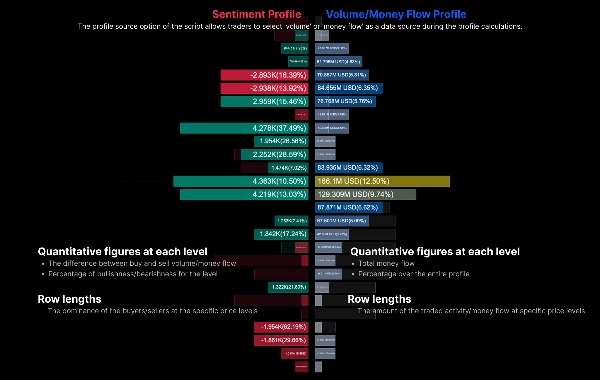
- 市場センチメントの分析:左にセンチメントプロファイル、右にボリュームプロファイルを表示することで、各価格レベルで買い手または売り手が支配しているかを判断します。
- 期間間比較:現在のプロファイルを前期間のゴーストプロファイルと直接比較し、市場の重心の変化を観察します。
⚙️ コアパラメータと使用ガイド
1. 一般設定
- ルックバック長 / 固定範囲:プロファイル計算に使用する過去バーの数を定義します(例:直近200バー)。
- データソース:
-
1 = ボリューム:従来のティック/取引量に基づいてプロファイルを計算します。2 = マネーフロー:価格の深さを取り入れてマネーフローの分布を計算します。
2. プロファイル設定
- 行解像度(行数):縦軸の粒度を決定します。数値が大きいほど(例:50-100)、より詳細なプロファイルになります。
- プロファイル幅と水平オフセット:プロファイルの描画幅(パーセンテージ)と右方向へのオフセット量を調整し、現在のローソク足との重なりを防ぎます。
3. センチメントと表示
- センチメントの極性:
-
1 = ローソク足:ローソク足の始値と終値(極性)のみで強気/弱気のセンチメントを決定します。2 = 買い/売り圧力:ヒゲや高値/安値に対する終値を考慮したより精密な計算を使用します。
- センチメントプロファイル / ボリュームプロファイルの表示:ネットセンチメントプロファイル(左)とメインのボリュームプロファイル(右)を独立して表示切替できます。
- 前期間の表示:有効にすると、前期間の同じ時間帯を表す背景の「ゴーストバー」プロファイルを描画します。サポート/レジスタンスの変化を追跡するのに便利です。
4. 拡張エリア表示
- ヒートマップの表示:計算期間全体のプロファイル密度を背景のヒートマップとして投影します。「ボリューム」または「センチメント」のいずれかを選択可能です。
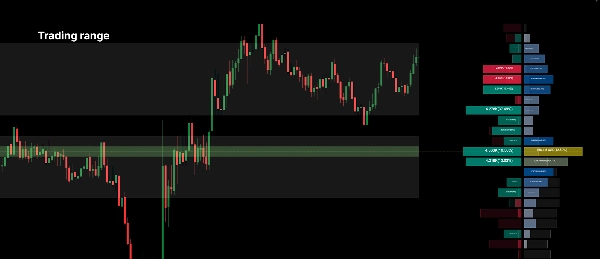
- バリューエリアの表示:取引量の大部分が発生した主要価格帯を強調表示します。閾値はカスタマイズ可能です(例:70%)。
- POCゾーンの表示:選択範囲のポイント・オブ・コントロール(最も取引量の多い価格レベル)に水平線とゾーンを自動描画します。
💡 実用的な取引のヒント:
- 強力なサポートまたはレジスタンスレベルとして機能する高ボリュームノード(ピーク)を探します。
- 価格が低流動性ゾーンを素早く通過しやすいため、低ボリュームノード(谷)を探します。
- 前期間のゴーストプロファイルを活用します:前期間のPOCよりも現在のPOC(黄色線)が高い位置に形成されている場合、価値のコンセンサスが上昇していることを示し、一般的に強気のシグナルです。
概要
AI summary
Money Flow Profile is an advanced indicator that maps traded volume and market sentiment across price levels over a specified time period. It visualizes the relationship between price and trader activity, highlighting key liquidity zones such as volume clusters and the Point of Control (POC). The tool displays a Sentiment Profile on the left and a Volume Profile on the right, enabling users to assess whether buyers or sellers dominate at each price level. It supports direct comparison with the previous period’s profile via a ghost overlay to track shifts in market value consensus.
Core configurable parameters include lookback length, data source selection (volume or money flow), row resolution for vertical granularity, profile width and offset, and sentiment polarity calculation methods (candle-based or buy/sell pressure). Display options allow toggling of sentiment and volume profiles, previous period overlays, heatmaps of volume or sentiment density, value area highlighting, and automatic POC zone marking.
The indicator is designed to help identify strong support and resistance levels at high volume nodes and anticipate rapid price movements through low volume nodes. It supports detailed volume and sentiment analysis to inform trading decisions based on liquidity and market structure.
Core configurable parameters include lookback length, data source selection (volume or money flow), row resolution for vertical granularity, profile width and offset, and sentiment polarity calculation methods (candle-based or buy/sell pressure). Display options allow toggling of sentiment and volume profiles, previous period overlays, heatmaps of volume or sentiment density, value area highlighting, and automatic POC zone marking.
The indicator is designed to help identify strong support and resistance levels at high volume nodes and anticipate rapid price movements through low volume nodes. It supports detailed volume and sentiment analysis to inform trading decisions based on liquidity and market structure.
インジケーターのプロフィール
インジケーターのカテゴリー
取引高
出力の種類
ビジュアル表示
データ要件
取引高
DoM
バーのみ
ティックデータ
サポート対象のシグナル
ブレイクアウト
トレンドの強さ
反転
ボラティリティ
ラインタッチ
ラインブレイク
カスタマーレビュー
0.0
レビュー: 0
カスタマーレビュー
この商品にはまだレビューがありません。お使いになったことがある方は、ぜひレビューをお願いします。
ディスカッション
よくあるご質問
Key Levels
Volume
cTrader Storeで入手可能な取引ボット、インジケーター、プラグインなどの商品は、第三者の開発者が提供するものであり、情報と技術の取得のみを目的としてご利用いただけます。cTrader Storeはブローカーではなく、投資助言や個人的な推奨を行うことも、将来のパフォーマンスを保証することもありません。
この作成者の他の商品





















価格
534.4M
取引数量
9.76M
獲得pips
4
販売