

「HEAT MAP DASHBORD V1」ロゴ
インジケーター
1 購入済
バージョン 1.1、May 2026
Windows、Mac
5.0
レビュー: 2
「HEAT MAP DASHBORD V1」アップロード画像
登録日 27/02/2026
5
販売
256
無料インストール

⚠️Update dropping soon⚠️

🔥 HEAT MAP DASHBOARD 📈

An Institutional-Grade Order Flow & Momentum Terminal for cTrader.

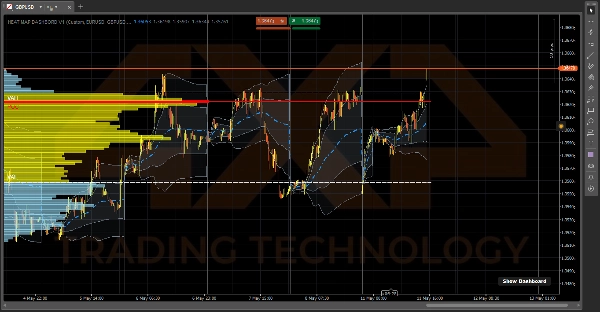
The Heat Map Dashboard isn't just a basic chart overlay—it is a three-part trading ecosystem built directly into your platform. It gives you "X-Ray" vision into market liquidity, true volume-weighted averages, and macro-level trends, all without slowing down your computer. ⚡

🎯 What It Does (The Trader's View)

The system breaks your trading down into three simple steps:

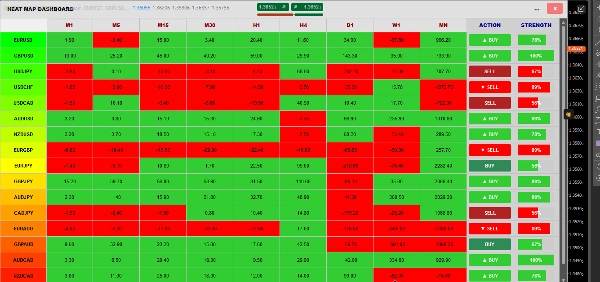
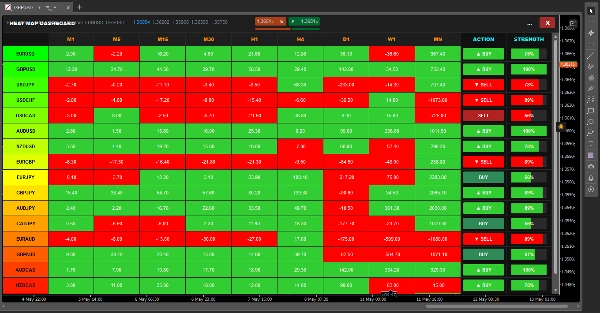
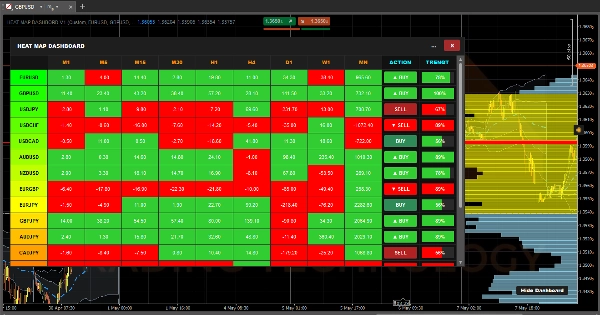
  • 🎛️ Step 1: WHAT to trade (The Matrix). Instead of clicking through dozens of charts, the dashboard scans 17 different assets across 9 timeframes (M1 to Monthly). It calculates the momentum for every single cell and color-codes it. At a single glance, you know exactly which pair is in a massive trend and ready to trade.
  • 🌊 Step 2: WHO is in control (The VWAP). Once you pick a pair, look at the Daily Anchored VWAP. It shows you the true average price based on volume, not just candlesticks. The shaded Standard Deviation clouds act as dynamic support/resistance, showing you exactly when the market is heavily overbought or oversold.
  • 📊 Step 3: WHERE to enter (The VRVP). Finally, the Visible Range Volume Profile maps out exactly where the heavy institutional liquidity is resting. It automatically draws your Point of Control (POC) and 70% Value Area (VAH & VAL) lines, giving you pinpoint accurate levels to execute your entries and exits.

⚙️ How It Works (Under the Hood)

Most indicators that try to do this much math will instantly freeze your platform and crash cTrader to 100% CPU usage. To prevent that, the Heat Map Dashboard is powered by three highly optimized, independent engines running simultaneously:

1. The Dashboard Engine (The 2-Second Heartbeat) ⏱️ If we calculated 153 combinations (17 pairs x 9 timeframes) on every single price tick, your computer would melt. Instead, this engine runs on a strict 2-second heartbeat timer. Every 2 seconds, it silently looks at the price from 14 candles ago, compares it to the current price, and paints the cell Green (positive momentum) or Red (negative momentum).

2. The VRVP Engine (The Screen Reader) 🖥️ Instead of loading thousands of bars of historical data, the Volume Profile acts as a dynamic "Viewport Listener." It only fires when you physically zoom or scroll your chart. It asks cTrader exactly which candles are currently visible on your screen, calculates the exact volume overlap for those specific bars, and instantly redraws the 70% Value Area.

3. The VWAP Engine (The Tick Accumulator) 🧮 The VWAP is the only thing that calculates on the live tick. However, to keep it lightning-fast, it uses a lightweight "Cumulative Data Series." Instead of recalculating the whole day every second, it simply adds the new tick's volume to a running background total, and automatically wipes itself clean the exact millisecond the clock strikes midnight.

4. The Window Manager (The Shape-Shifter) 🪟 The dashboard is wrapped in a custom C# sizing logic that actively listens to your monitor. When you hit the Maximize [ ] or Restore [=] buttons, the indicator dynamically reads your Chart.Width and Chart.Height in real-time, instantly shape-shifting to fit your screen perfectly without collapsing!

インジケーターのプロフィール
インジケーターのカテゴリー
市場構造(SMC)
出力の種類
ビジュアル表示
シグナル
フィルター
データ要件
ティックデータ
バーのみ
取引高
外部データ
DoM
サポート対象のシグナル
トレンドの強さ
クロス
ダイバージェンス
ブレイクアウト
反転
ボラティリティ
ラインタッチ
ラインブレイク
セッション開始レンジ
5.0
レビュー: 2
5
100 %
4
0 %
3
0 %
2
0 %
1
0 %
カスタマーレビュー
May 10, 2026
A small signal sample gives a cleaner read, and bad impulses show up less often in the notes.
May 8, 2026
HEAT MAP DASHBOARD V1 is a clean and practical multi-timeframe momentum dashboard. It provides a fast overview of bullish and bearish alignment across several timeframes and combines it with pivot levels for additional context. The interface is intuitive, lightweight, and useful for filtering choppy conditions. Best used as a market bias and scanning tool rather than a standalone signal system.
Aggressive
Supertrend
Liquidity Sweep
Market Structure
High Frequency
Risk Dashboard
Support & Resistance
cTrader Storeで入手可能な取引ボット、インジケーター、プラグインなどの商品は、第三者の開発者が提供するものであり、情報と技術の取得のみを目的としてご利用いただけます。cTrader Storeはブローカーではなく、投資助言や個人的な推奨を行うことも、将来のパフォーマンスを保証することもありません。

この作成者の他の商品

インジケーター
Crypto
GBPUSD
+7
GUPPY TREND MASTER V3.. Visualize Market Sentiment with the 38-EMA Rainbow The Guppy Trend Master 4X4 Indicator
インジケーター
ATR
RSI
+11
This indicator puts three helpful trading tools on your chart at once. Think of it like having three expert traders
インジケーター
AI-assisted
Tired of staring at the same old charts? The Theme Customizer indicator brings a whole new level of personalization
インジケーター
ATR
EMA
+4
The FULL-MARKET-VIEW-DASHBOARD is a professional-grade trading suite for cTrader that eliminates market noise.
インジケーター
RSI
AI-assisted
+1
Transform how you view market momentum with the RSI Velocity Gauge Pro. It's FREE FOR ALL
インジケーター
Market Structure
Stop guessing which trading session you in, with Sessions indicator sessions are in your finger tips like a pro

これも好きかも

インジケーター
ATR
Flag
+5
Decision panel with Buy/Sell scores, market bias, setup quality, trading cost and clear trade reasons.
インジケーター
RSI
Signal
+1
🚀📈 Plot buy/sell signals on Range Bars using Moving Averages and RSI. Clear, actionable trading insights.🚀📈
インジケーター
Plots intraday VWAP and dynamic ±1/±2 standard deviation (SD) bands based on current day’s price and volume.
インジケーター
SMC
Forex
+5
Pure Price Action ICT Tools
インジケーター
Shows daily and sessions highs / lows and session boxes, everything configurable
インジケーター
AI
ATR
+27
VolumeProfileSuite is an advanced and flexible Volume Profile indicator for cTrader.
インジケーター
BOS
Key Levels
+2
Realtime Trade Adviser will tell you When to BUY and When to SELL. A real time Trade Prompter
インジケーター
Supertrend
smart System
インジケーター
VWAP
VWAP Set to Tokyo Open
インジケーター
Signal
Order Flow Market Depth Pro | Footprint & DOM
インジケーター
This indicator is a simple, single-timeframe tool for showing candle sentiment directly on your chart. If you want a mor
インジケーター
EMA
RSI
+2
Advanced TDI indicator with Shark Fin signals, chart arrows, MTF RSI, divergence detection and smart alerts.
インジケーター
CCI
Volume
Monitor multiple pairs and timeframes with this interactive CCI dashboard. Includes mini-charts & Alerts.
インジケーター
Forex
Crypto
+4
Spot powerful 3-candle reversal patterns like Morning/Evening Star and Soldiers/Crows at key swing highs and lows
インジケーター
cTreder Smart SMA
インジケーター
AI
ATR
+26
Entry Momentum MACD Power Guide
インジケーター
Crypto
GBPUSD
+7
GUPPY TREND MASTER V3.. Visualize Market Sentiment with the 38-EMA Rainbow The Guppy Trend Master 4X4 Indicator
インジケーター
Prop
E7 BBKG indicator with 80% plus accuracy used to show both, possible reversal and trend.
登録日 27/02/2026
5
販売
256
無料インストール

























