present
新規登録で初回購入時に$50オフ
Trading product for Level 2 DOM Volume Delta Pro インジケーター Key Levels BOS, image 1
Level 2 DOM Volume Delta Pro
インジケーター
5 購入済
バージョン 1.0、Apr 2026
Windows、Mac
4.5
レビュー: 2
Trading product for Level 2 DOM Volume Delta Pro インジケーター Key Levels BOS, image 2
Trading product for Level 2 DOM Volume Delta Pro インジケーター Key Levels BOS, image 3
Trading product for Level 2 DOM Volume Delta Pro インジケーター Key Levels BOS, image 4
登録日 18/01/2026
14
販売

説明

LAST WEEK OF THE SUMMER PROMO


This is not your typical Volume Delta Indicator. This is the Level 2 DOM Volume Delta Indicator — Institutional-Grade Order Flow for cTrader. The Edge Institutions Pay Millions For.


The Problem Every Retail Trader Faces. A candle closes green. Volume is high. You buy.

Price reverses instantly. You get stopped out. The chart "lied" to you.

It didn't lie — you just couldn't see what was happening inside the candle. That green bar with high volume? 70% of that volume was aggressive selling. The close was propped up by a thin layer of buy orders at the bottom of the range. Institutions were distributing into your buy order.

Standard volume indicators show you the total. They never show you who was in control.


Volume Delta changes that. What Volume Delta Actually Shows You

Volume Delta separates every bar's volume into buy volume and sell volume, then calculates the difference — the delta. A positive delta means buyers were more aggressive. A negative delta means sellers dominated.

This is the single most important piece of information that separates professional traders from retail traders: not how much was traded, but which side was trading more aggressively. That's conviction. The delta is the fingerprint of intent behind every price bar.


But it does not stop there

This indicator doesn't guess. In a proprietary mix of data it reads Level 2 Market Depth data — the actual order book sitting behind the price you see on screen.

Level 2 data (also known as DOM — Depth of Market) shows the real buy and sell orders stacked at every price level. Not the last trade. Not an estimate. The actual resting liquidity from banks, hedge funds, and institutional desks flowing through your broker's liquidity providers.

The result is an accuracy level of 85-95% in classifying buy versus sell volume — far beyond what any formula-based approximation can achieve.


Why This Matters — What Institutions See That You Don't

Goldman Sachs, Citadel, Jump Trading — they all trade with order flow data. They see the buy and sell pressure in real time. They see absorption. They see when a level is being defended. They see when the delta diverges from price.

They pay millions for this infrastructure. The data feeds, the co-located servers, the proprietary tools.

This indicator brings the same core concept to your cTrader chart. Not a watered-down version. The actual Level 2 DOM data from your broker's liquidity pool, processed into the same buy-versus-sell classification that professional order flow traders use.

The difference between a retail trader and an institutional trader isn't intelligence. It's information. Volume Delta closes that gap.


Who This Is For

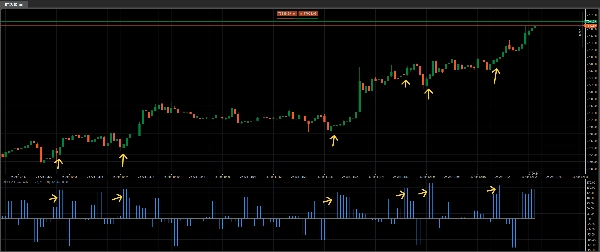
Day traders who want to see through the noise. When a candle looks bullish but the delta is negative, you know to wait. When a candle looks weak but the delta is strongly positive, you know institutions are accumulating. The delta doesn't lie — it shows what happened, not what it looked like.

Scalpers who need to know which side is in control right now. A spike in delta on a breakout confirms it's real. A breakout with flat delta tells you it's a trap before the reversal even starts.

Swing traders who want confluence. Delta divergences — where price makes a new low but delta is rising — are among the most reliable reversal signals in professional trading. This indicator detects them automatically.

Anyone trading forex, indices, or commodities on cTrader with a broker that provides Level 2 data. Fusion Markets, IC Markets, Go Markets, and similar ECN/STP brokers all provide the DOM data this indicator reads.

If you've ever been on the wrong side of a "high volume" candle, this is the tool that tells you why.


What You Get

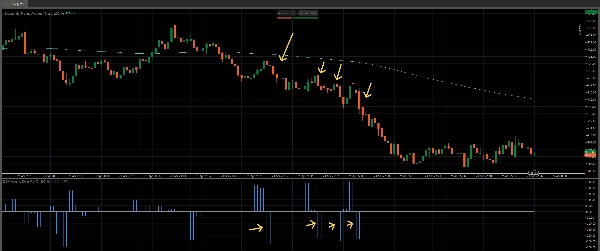
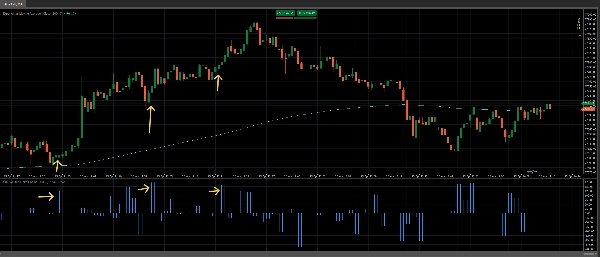
A clean, professional histogram below your chart showing the net delta for every bar, based on highly accurate data. Positive bars mean buyers dominated. Negative bars mean sellers dominated. The size of the bar shows you how much one side outweighed the other.

No clutter. No lagging moving averages of volume. No colored candles that "estimate" buying and selling. Just the raw, unfiltered difference between aggressive buying and aggressive selling — calculated from the deepest data source available to retail traders.


One look at the delta bar tells you what ten other indicators try to approximate. Get yours now for cTrader. This is a no-brainer for this low price.


How to use this indicator

  • Determine the highest Volume Delta Values on the indicator by looking at the value of the highest bars and fill out this value in the Volume Delta field of the indicator. This value is different for every pair and timeframe, so it needs to be set once based on the chart you trade
  • Set the Total Volume value at maximum 2 times the Volume Delta value. So the Volume Delta is maximum 50% of the Total Volume value. A good value for the Volume Delta is between 70%-80% of the Total Volume. Example: Total Volume value is 1000, Volume Delta = between 700-800
  • Use this indicator in conjunction with a 200 EMA or VWAP to determine the trend and only look at buys above the line and sells below the line
  • If desired use optional aggregation of bars for smoother bar movement. Consider to change the volume values as well as 2 aggregated bars have a larger Total Volume and Volume Delta than 1 bar


Combine this with our Volume Profile Pro indicator for even better informed decisions at key levels: https://ctrader.com/products/4079


See our amazing Black Box Bot here: https://ctrader.com/products/3241

概要

AIによる概要
Level 2 DOM Volume Delta Pro is an institutional-grade volume delta indicator designed for the cTrader platform. It analyzes Level 2 Depth of Market (DOM) data—real-time order book information showing buy and sell orders at each price level—to distinguish aggressive buying from selling within each price bar. By combining tick direction analysis (classifying volume based on price ticks) with DOM imbalance (measuring resting bid vs. ask volume), it achieves 85-95% accuracy in identifying buy versus sell volume.

The indicator displays a clean histogram below the chart representing net volume delta per bar: positive bars indicate buyer dominance, negative bars indicate seller dominance, and bar size reflects the strength of that dominance. This provides traders with insight into market intent beyond total volume, revealing whether buyers or sellers controlled the price action.

It supports forex, indices, and commodities trading with brokers offering Level 2 data, such as Fusion Markets and IC Markets. Features include volume filtering and aggregated volume bars. The tool is suited for day traders, scalpers, and swing traders seeking to interpret order flow, confirm breakouts, detect divergences, and enhance decision-making with professional-level order flow data.
インジケーターのプロフィール
インジケーターのカテゴリー
取引高
出力の種類
ビジュアル表示
データ要件
ティックデータ
DoM
取引高
サポート対象のシグナル
ブレイクアウト
反転
トレンドの強さ
ボラティリティ
ダイバージェンス
ラインブレイク

カスタマーレビュー

4.5
レビュー: 2
5
50 %
4
50 %
3
0 %
2
0 %
1
0 %
カスタマーレビュー
May 8, 2026
Level 2 DOM Volume Delta Pro provides a clean and useful view of buy vs sell aggression using delta and DOM-based analysis. It helps traders better understand what is happening inside each candle and can improve breakout or reversal confirmation. The tool is especially useful for scalping and intraday trading, although DOM quality still depends on the broker’s available data feed.
May 6, 2026

ディスカッション

よくあるご質問

Key Levels
BOS
Imbalance
Volume
Market Structure
Supply & Demand
Support & Resistance
cTrader Storeで入手可能な取引ボット、インジケーター、プラグインなどの商品は、第三者の開発者が提供するものであり、情報と技術の取得のみを目的としてご利用いただけます。cTrader Storeはブローカーではなく、投資助言や個人的な推奨を行うことも、将来のパフォーマンスを保証することもありません。

この作成者の他の商品

cBot
Volume
XAUUSD
+5
The Black Box Bot, A New Revolution. Make up to almost 700% per year on Gold m5.
インジケーター
Volume
Key Levels
+5
Volume Profile Pro - A Lightweight and Highly Customizable Volume Profile

これも好きかも

インジケーター
Engulfing
Fibonacci
+4
Six higher-timeframe candle sets on one chart, with liquidity sweep detection and swept levels.
インジケーター
ADX
ATR
+5
Signal Quality Score - 0-100 filter combining RSI, Volume, ATR, Trend Strength & Alignment. Works on ANY chart type.
インジケーター
AI
SMC
+5
Complete ICT Killzones: 5 sessions, easy colors, transparency controls & session info. Professional timing for cTrader.
インジケーター
ATR
RSI
+24
Daily moving averages, simplified. Displays 3 daily moving averages on lower timeframes with selectable MA types.
インジケーター
Prop
Forex
+11
🧭 See when your market tends to move—by Month, Day-of-Week, or Hour-of-Day🧭
インジケーター
AI
ATR
+10
FX Sniper: Multi-pair Forex analysis tool. Features trend logic, adaptive pivots, and momentum filtering for major pairs
インジケーター
AI
SMC
+14
Refined cleaner version of Key Levels indicator with broker UTC offset, styles & label alignment.
インジケーター
AI
ATR
+26
Entry Momentum MACD Power Guide
インジケーター
Forex
BTCUSD
+11
Auto-detects Bullish/Bearish Engulfing patterns to spot trend reversals. Real-time alerts, custom colors, all symbols.
インジケーター
Moving Average
Support & Resistance
Adaptive, low-lag moving average designed to smooth noise while responding quickly to changing market conditions.
インジケーター
RSI
Forex
+4
New version of one of my favorites includes Fibonacci and moving average convergence divergence lines
インジケーター
BOS
CHOCH
+5
A professional-grade cTrader indicator for traders following the Inner Circle Trader (ICT) methodology.
インジケーター
Prop
Forex
+11
🌊 See when the market is truly in play. Tsunami measures Relative Volume by time-of-day 🌊
インジケーター
Key Levels
Support & Resistance
Clean psychological round-number grid with native pip and point auto-scaling across Forex, Gold, Indices, and Crypto.
インジケーター
AI
ATR
+27
Market Cipher B
インジケーター
EMA
RSI
+5
MACD Colour Histogram with 11 Moving Average Types, Multi-timeframe confirmation and Sound Signal Alert.
インジケーター
SMC
Forex
+5
ICT liquidity engine for Gold: maps stop clusters, scores zones & projects the next target. Now with 4 ICT killzones.
インジケーター
Prop
Forex
+12
A clean, real-time risk HUD designed to prevent prop firm account failure and protect your challenge account.

価格

登録日 18/01/2026
14
販売