
Supply&Demand
インジケーター
4 購入済
バージョン 1.0、May 2025
Windows、Mac
4.7
レビュー: 4
説明
⚡ 主な特徴
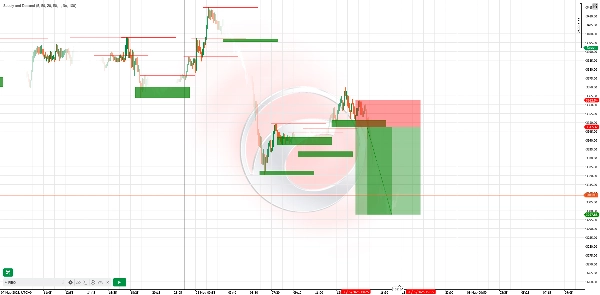
- ダイナミックゾーン検出
-
- スイングの高値・安値を自動検出し、リアルタイムで供給(レジスタンス)&需要(サポート)ゾーンを描画します。
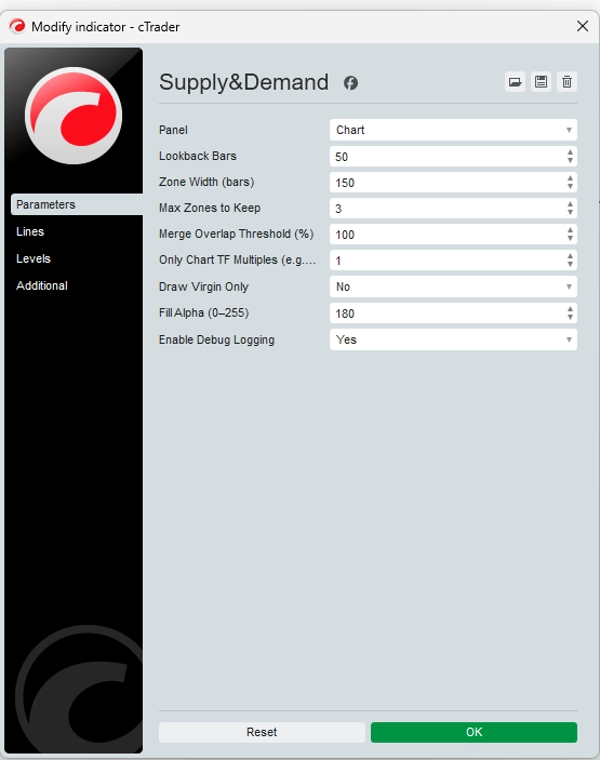
- 設定可能なルックバック&ゾーン幅パラメータで、あらゆる市場や時間枠に感度を調整可能です。
- バージンゾーンの強調表示
-
- 価格が一度も触れていない新鮮な「バージン」ゾーンを視覚的に強調表示し、機関投資家が注文を残した場所で取引できます。
- 触れられたゾーンを非表示にしてチャートをすっきり保つことも可能です。
- マルチタイムフレームフィルタリング
-
- チャートの時間枠の倍数に合致するゾーンのみを表示(例:1時間チャートに日足ゾーンを表示)。
- 高時間足の供給・需要ゾーンと日中のセットアップの合流を素早く確認できます。
- 非再描画&非遅延
-
- 一度描画されたゾーンは固定され、価格変動後に消えたり移動したりしません。
- バックテスト済みの信頼性:ゾーンは静的に保たれ、過去の分析に自信を持てます。
- カスタムアラート&ログ記録
-
- 価格がゾーンに入るか突破した際にポップアップやメールで通知を受け取れます。
- 詳細なデバッグログでゾーン作成、重複スキップ、ゾーン接触を確認可能です。
🚀 仕組み
- ピボット検出: インジケーターは選択したルックバックに基づき、各新しいバーでピボット高値(供給)とピボット安値(需要)をスキャンします。
- ゾーン構築: 各ピボットに対して、機関投資家がおそらくリミット注文を置いたであろう場所を強調する長方形ゾーンを前方に描画します。
- 重複フィルタリング: 閾値を超える重複ゾーンは統合またはスキップされ、最も重要なエリアのみが残ります。
- バージンのみオプション: 未触及のゾーンのみを表示し、最も新鮮な機関レベルに集中できます。
🎯 取引戦略の例
戦略時間枠エントリーストップロステイクプロフィット
ゾーン拒否
H1
価格が需要ゾーンに上昇し、供給ゾーンでベアリッシュなローソク足(包み足/ピンバー)を示すのを待ちます
ゾーン境界のすぐ外側
ゾーンの高さの1.5倍
時間枠の合流
M15 + H4
H4の需要ゾーンを特定し、その後M15に切り替えてそのゾーン内の強気の勢いローソク足を確認します
H4ゾーンの安値の下
次のH4スイング高値
ブレイク&リテスト
H4
価格が供給ゾーンを突破した後、ゾーンの下側のリテストとベアリッシュな確認を待ちます
ゾーンの上限の上
最近のH4安値
使用のヒント: ゾーン内でRSIやMACDのダイバージェンスと組み合わせると、より高確率のシグナルになります。
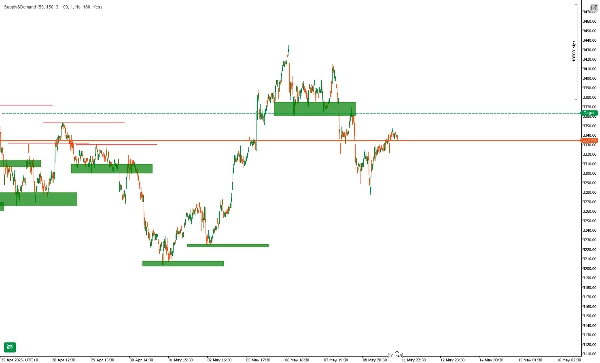
📈 実例
- EURUSDのH4で、インジケーターは1.0950–1.0980の需要ゾーンを描画します。
- 価格がゾーンに入り、M15の強気包み足を形成します。
- エントリーは1.0970、ストップはゾーン下の1.0945、ターゲットは次のH4レジスタンス1.1040です。
- 結果:+70ピップス(リスクの約6.4倍)。
⚠️ 免責事項
このインジケーターはツールであり、利益を保証するシステムではありません。過去のパフォーマンスが将来の結果を保証するものではありません。常に適切なリスク管理(例:取引ごとに最大2%)を行い、まずデモ口座でテストし、ご自身の分析と組み合わせてください。取引には損失リスクが伴い、失ってもよい資金のみで取引してください。
概要
AIによる概要
Supply&Demand is a trading indicator that automatically identifies and plots key supply (resistance) and demand (support) zones on price charts in real time. It detects swing highs and lows using configurable lookback and zone-width settings, adapting to any market or timeframe. The indicator highlights “virgin” zones—areas untouched by price—emphasizing potential institutional order levels, with an option to hide touched zones for chart clarity.
It supports multi-timeframe filtering, allowing users to display zones aligned with higher timeframe multiples on lower timeframe charts, facilitating confluence analysis. Zones are non-repainting and non-lagging; once drawn, they remain fixed, ensuring reliable historical analysis. Custom alerts notify users when price enters or breaks these zones, and detailed logs track zone creation and interactions.
The indicator operates by scanning each new bar for pivot highs and lows, constructing rectangular zones extending forward, and filtering overlapping zones to retain the most significant areas. It offers a “virgin-only” mode to focus on fresh institutional levels.
Example strategies include zone rejection, multi-timeframe confluence, and break & retest setups, often combined with RSI or MACD divergence for higher-probability signals. A real-world example on EURUSD H4 demonstrates entry, stop-loss, and take-profit placement based on demand zones and candlestick confirmation.
インジケーターのプロフィール
カスタマーレビュー
4.7
レビュー: 4
5 | 75 % | |
4 | 25 % | |
3 | 0 % | |
2 | 0 % | |
1 | 0 % |
カスタマーレビュー
November 9, 2025
A solid Supply & Demand tool - clear zones, stable performance, and visually neat. Great for spotting imbalances and retracement entries. Would love built-in alerts, but overall it’s a reliable companion for swing and intraday setups.
May 23, 2025
The main upside is low quality setups lose some appeal. It can look better than it is during a lucky run.
May 18, 2025
The first 10 trades should stay boring, and unclear signals stop looking so clean.
May 15, 2025
ディスカッション
よくあるご質問
EURUSD
RSI
MACD
cTrader Storeで入手可能な取引ボット、インジケーター、プラグインなどの商品は、第三者の開発者が提供するものであり、情報と技術の取得のみを目的としてご利用いただけます。cTrader Storeはブローカーではなく、投資助言や個人的な推奨を行うことも、将来のパフォーマンスを保証することもありません。


価格
登録日 22/11/2024
133
販売
2.57K
無料インストール