
説明
「Initial Range」インジケーターとは何ですか?
このインジケーターは、Pine Scriptの「Opening Range Breakout」ツールの移植版です。
元々は ORB – Opening Range Breakout と呼ばれていました:セッションの最初の数分の価格範囲を取り、その範囲の ブレイクアウト を取引します。
このバージョンでは名前を IR – Initial Range に変更しましたが、考え方は同じです:
- インジケーターは複数の Initial Ranges を構築します:
-
- IR5 – 最初の5分
- IR15 – 最初の15分
- IR30 – 最初の30分
- IR60 – 最初の60分
- 各IRには以下があります:
-
- IR High
- IR Low
- IR Mid(範囲の中間点)
- どの範囲を有効にし、どの色を使うか選択できます。
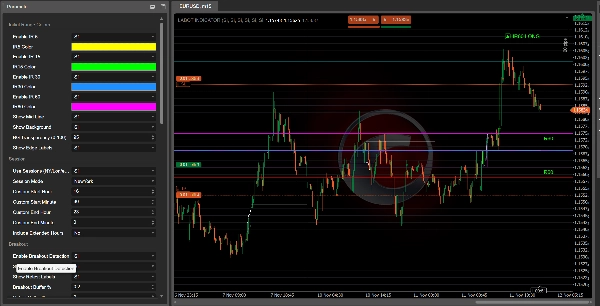
範囲が完成すると、インジケーターは価格がその範囲をブレイクするかどうかを探します:
- IR Highを上抜け → IR60 LONG、IR30 LONGなど。
- IR Lowを下抜け → IR60 SHORT、IR30 SHORTなど。
これらのラベルはチャート上に表示され、どの初期範囲がシグナルを出したかをすぐに確認できます。
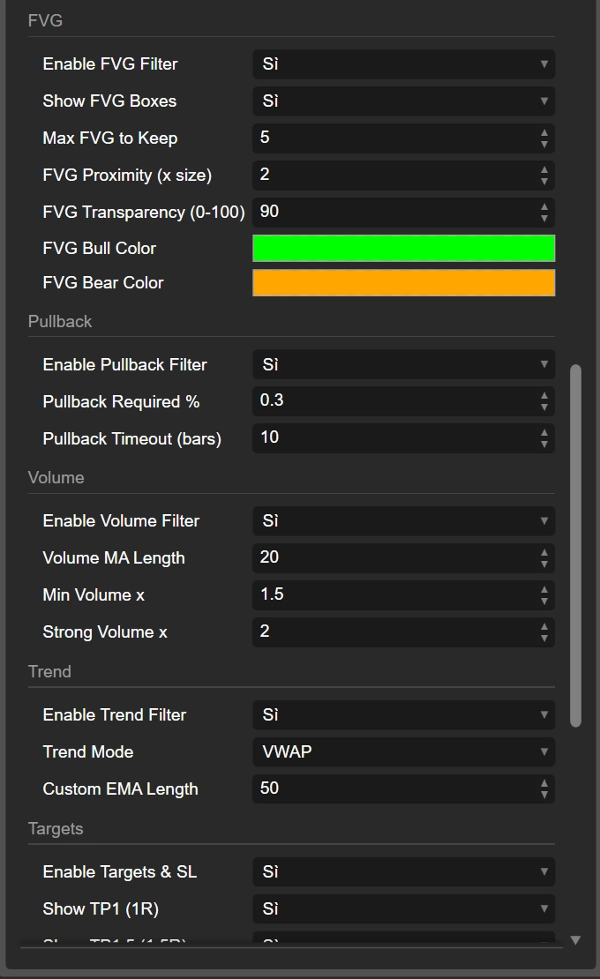
フィルターと確認
インジケーターは複数のフィルターを組み合わせてランダムなブレイクアウトを避けるよう設計されています:
- トレンドフィルター
以下を使用できます: -
- VWAP
- EMA
- カスタムEMA期間
- VWAP + EMAの組み合わせ
トレンド方向のブレイクアウトが優先されます(例:価格がVWAP/EMAの上にある場合のみLONG)。
- ボリュームフィルター
インジケーターは現在のボリュームをボリュームの移動平均と比較します: -
- 「通常」の確認
- 「強い」ボリューム
弱いボリュームのブレイクアウトは無視することも可能です。
- FVG(フェアバリューギャップ)フィルター
強気および弱気のFVGを検出し、ブレイクアウトが関連するFVG付近で起こることを要求できます: -
- IR High付近の強気FVGは LONG をサポートします
- IR Low付近の弱気FVGは SHORT をサポートします
- プルバックフィルター
ブレイクアウト後の最低限のプルバックと、そのプルバックが起こる時間枠(バー数)を要求できます。これにより、実際に「呼吸」してから続行するブレイクアウトに集中できます。
ブレイクアウト、リテスト、失敗したブレイク
Initial Rangeからのブレイクアウト後、インジケーターは価格の次の動きを追跡します:
- 範囲外にとどまるバーの数を カウントします。
- 価格が 十分に遠くへ 移動したかどうかをチェックします(最小距離%)。
- その後、範囲内への リテスト を監視します。
以下が確認できます:
- IR60 LONG / IR60 SHORT(ブレイクアウト)
- Retest LONG / Retest SHORT ラベルは価格がしっかり動いた後に戻ってきたことを示します
- Failed LONG / Failed SHORT ラベルはブレイクアウトがすぐに失敗し、価格がコミットメントなしに範囲内に再突入したことを示します。
これにより、3種類の情報が得られます:
- クリーンなブレイクアウト
- リテストを伴う健全なブレイクアウト
- 偽/失敗したブレイクアウト
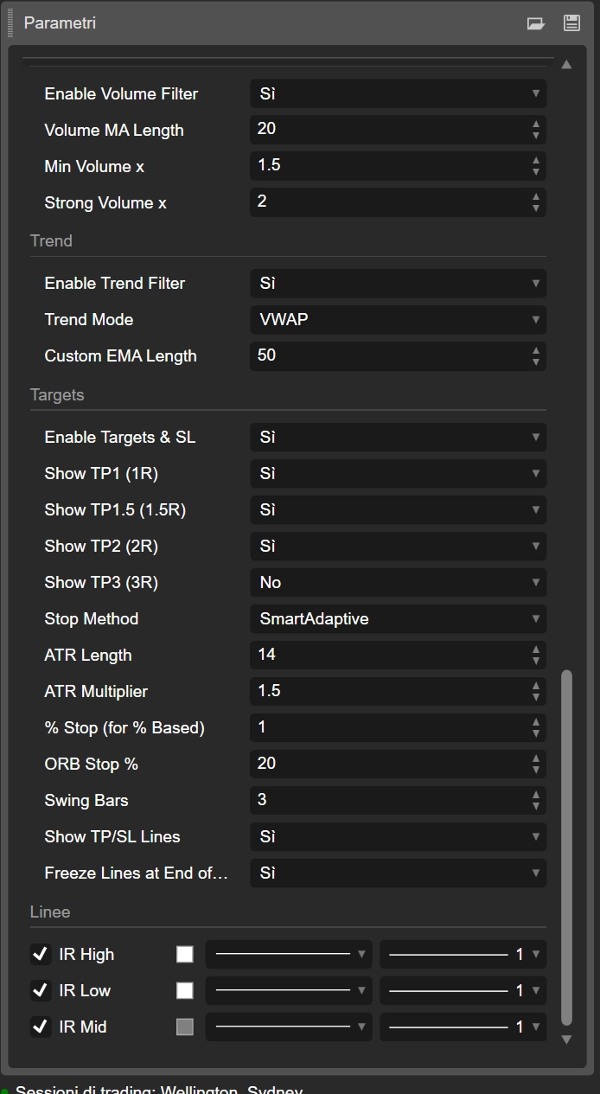
ターゲット、ストップロス、トレードの視覚化
インジケーターはまた、以下に基づいて 自動TPおよびSLレベル を計算します:
- ATR
- IR幅の%
- 固定%ストップ
- スイングポイント
- 「スマート」適応型およびスケールされたATRモード
エントリー価格とストップレベルから複数のターゲットを計算します:
- TP1 (1R)
- TP1.5 (1.5R)
- TP2 (2R)
- TP3 (3R)
表示するターゲットを選択できます。
チャート上にラインが描画されます:
- IR_ENTRY_LONG / IR_ENTRY_SHORT
- IR_SL_LONG / IR_SL_SHORT
- IR_TP1 / IR_TP1.5 / IR_TP2 / IR_TP3
価格がターゲットまたはストップに達すると状態が更新され、設定に応じて最後のTP後または日終わりにラインが「固定」されます。
まとめ
- 旧名称: ORB(Opening Range Breakout)
- 新名称: IR(Initial Range)– 同じコンセプトで、より洗練された名称
- 早期セッションの範囲(IR5、IR15、IR30、IR60)を構築します
- LONG / SHORTのブレイクアウト、リテスト、および失敗したブレイク
- 品質向上のために トレンド、ボリューム、FVG、プルバックフィルター を使用します
- チャート上に エントリー、ストップ、複数のターゲット を直接描画します
チャート上に 「IR60 LONG」 と表示されている場合、それは基本的にセッション最初の60分のOpening Range Breakoutを見ていることになります。よりモダンでカスタマイズ可能な名前と多くの追加ロジックが背後にあります。
概要
The indicator marks breakout signals when price moves above the range high (LONG) or below the range low (SHORT), displaying corresponding labels on the chart. It also tracks retests and failed breakouts, distinguishing clean breakouts, healthy retests, and fake moves.
To improve signal quality, the indicator incorporates multiple filters: trend filters using VWAP and EMA, volume filters comparing current volume to averages, Fair Value Gap (FVG) filters detecting bullish or bearish imbalances near breakout levels, and pullback filters requiring minimum retracements after breakouts.
Additionally, it calculates and plots automatic entry, stop loss, and multiple take profit levels based on ATR, percentage of the initial range width, fixed percentages, swing points, and adaptive ATR modes. These visual aids help traders manage risk and targets directly on the chart.
The Initial Range indicator supports various markets including Forex, stocks, indices, commodities, and cryptocurrencies, and is designed to enhance breakout trading strategies with customizable parameters and comprehensive trade visualization.
カスタマーレビュー
5 | 100 % | |
4 | 0 % | |
3 | 0 % | |
2 | 0 % | |
1 | 0 % |


![「Smart Money Concepts (SMC) [Iridio Capital]」ロゴ](https://cdn.ctrader.com/image/webp/28b69fd1-ef54-4bed-9487-07e78e883be4_40934)
![「[Stellar Strategies] Market Session Ultimate」ロゴ](https://cdn.ctrader.com/image/webp/61ffd537-0125-4246-9e72-42eca1791d64_28232)


