
AlgoCorner Correlations Map
インジケーター
1 購入済
バージョン 1.0、Oct 2025
Windows、Mac
4.6
レビュー: 3
説明
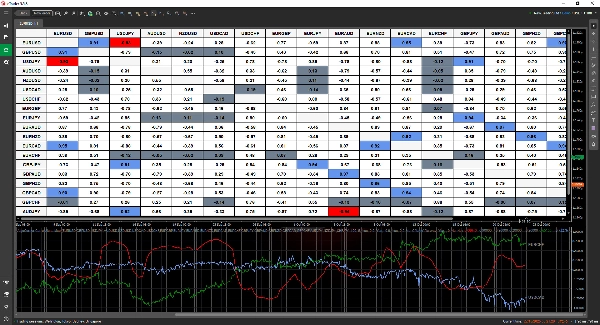
相関マップ– 市場洞察のための必須ツール
この 相関マップ は、資産間の関係を一目で把握できるように設計された強力で直感的なインジケーターです。読みやすい表形式で、相関をすばやく見つけて、より情報に基づいた取引判断を下すことができます。
✅ 分析のカスタマイズ – プラットフォームが許す限り多くの取引ペアを選択して比較できます。
✅ 柔軟な時間軸 – 戦略に合わせて任意の時間枠で相関を分析します。
✅ 明確で適応可能な表示 – 小数点(-1から1)またはパーセンテージ(-100%から100%)形式を選択できます。
✅ スマートハイライト – カスタマイズ可能な色分けで強い相関と弱い相関を簡単に識別できます。
✅ リアルタイムアラート – 相関値が大きく変化したときに通知を受け取って先手を打てます。
✅ インタラクティブデータ – 任意のセルをクリックして、相関の変化を時間とともに追跡できます。
✅ 継続的な改善 – 今後のアップデートを追加費用なしでお楽しみいただけます。
相関マップで主要な市場関係を発見し、取引戦略を洗練させましょう! 🚀
概要
AIによる概要
AlgoCorner Correlations Map is an indicator designed to display correlations between multiple assets in a clear, table-based format. It allows users to select and compare numerous trading pairs across various markets including Forex (e.g., EURUSD, GBPUSD, NZDUSD), commodities (e.g., gold/XAUUSD), and others. The indicator supports flexible timeframes, enabling analysis that aligns with different trading strategies.
Key features include customizable display options with correlation values shown in decimal (-1 to 1) or percentage (-100% to 100%) formats, and smart color-coded highlighting to quickly identify strong or weak correlations. Users can interact with the data by clicking on any cell to track how correlations evolve over time. Real-time alerts notify users of significant changes in correlation values, aiding timely decision-making.
This tool is intended to help traders uncover relationships between assets efficiently, supporting more informed market analysis and strategy refinement.
インジケーターのプロフィール
カスタマーレビュー
4.6
レビュー: 3
5 | 67 % | |
4 | 33 % | |
3 | 0 % | |
2 | 0 % | |
1 | 0 % |
カスタマーレビュー
November 4, 2025
October 26, 2025
demo first, then maybe small size if the notes look sane. Forcing the entry still creates problems.
October 23, 2025
The idea is fine, just do not expect it to print perfect entries. 20 signals is a fair first sample.
ディスカッション
よくあるご質問
Forex
EURUSD
Commodities
GBPUSD
NZDUSD
XAUUSD
cTrader Storeで入手可能な取引ボット、インジケーター、プラグインなどの商品は、第三者の開発者が提供するものであり、情報と技術の取得のみを目的としてご利用いただけます。cTrader Storeはブローカーではなく、投資助言や個人的な推奨を行うことも、将来のパフォーマンスを保証することもありません。
この作成者の他の商品


![「[Hamster-Coder] Bollinger Bands」ロゴ](https://cdn.ctrader.com/image/webp/21d8e5d6-fb11-4bac-b9ee-cd05c2b76804_30327)


価格
11
販売
354
無料インストール