
説明
MarketSessions – あなたのトレーディングエッジを視覚化
マーケットタイムをトレーディングパワーに変える
MarketSessions は、グローバルなマーケットセッションを生き生きと表現するプロフェッショナルグレードのcTraderインジケーターです。これにより、勢いが本物の場所で取引し、タイミングをあなたの強みにできます。
🚀 なぜトレーダーはMarketSessionsを信頼するのか
マーケットのリズムを見よう
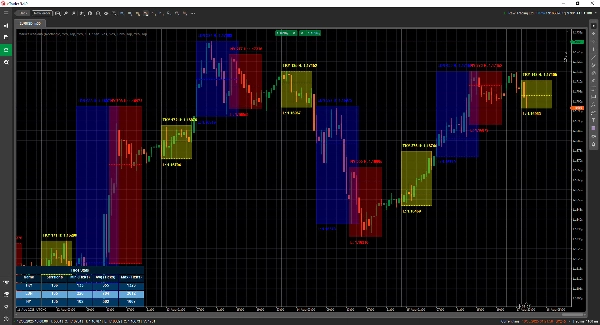
ロンドン、ニューヨーク、東京、シドニー、そして他の任意のセッションを、チャートに適応するクリーンでエレガントなオーバーレイで瞬時に視覚化します。
よりスマートに取引しよう、遅くではなく
セッションの開始、終了、重要なレベル到達時にリアルタイム通知を受け取れます。通知はTelegramまたはDiscord(お好みで)で配信されます。
高確率ゾーンを攻める
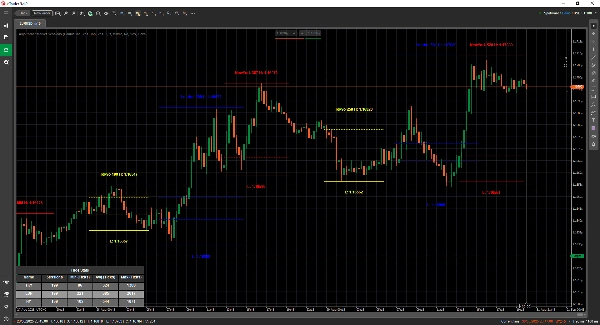
組み込みツールであるオープニングレンジブレイクアウト、ポイントオブコントロール(POC)、および精密なセッションラインを活用して、ブレイクアウトやリジェクションを見逃しません。
🎯 主な特徴
- セッションの視覚化と管理 – 重複するマーケットにも対応した完全カスタマイズ可能な時間、色、ラベル
- 高度な描画ツール – ダブル❘❘やミドルラインドローワー、ブレイクアウト矩形、テキストマーカー、そしてダブルラインモードを含み、ミニマリストトレーダー向け
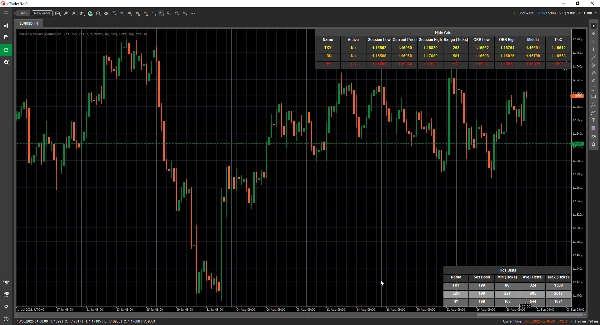
- 統計パネル – 各セッションの合計セッション数、最小、平均、最大レンジを(ティック、ピップ、%で)表示
- グリッドモード - 現在アクティブなセッションをテーブルで表示し、より高い時間軸でセッションを確認可能
- 柔軟な設定 – テキスト配置、レンジモード、描画設定、テーマのカスタマイズ
- アラートと統合 – サウンドと視覚アラート付きのTelegram/Discord統合
📦 何が手に入るか
- MarketSessions.algo(すぐに使用可能)
- 生涯アップデート(継続料金なし)
- 親切なサポート(助けが必要な場合は直接アクセス可能)
💻 必要条件
- cTraderプラットフォーム
- .NET 6.0ランタイム
✅ 数分でインストール
✅ 絶対的な自信を持って取引
📘 パラメータリファレンス(フレンドリーバージョン)
利用可能なセッション一覧
- ニューヨーク
- ロンドン
- フランクフルト
- 東京
- 香港
- 上海
- シンガポール
- ウェリントン
- シドニー
- トロント
一般設定
- 描画モード – セッションラインの描画方法を選択(矩形 / ダブルライン / ミドルライン)
- セッション名の表示 – チャート上に各セッションの名前を表示
- セッション名の位置 – セッション名テキストの表示位置を決定(上、中央、下)
- テキストを太字に – セッション名を読みやすく太字にする
- 上部テキストオフセット – 上部からの余白を追加(テキストがローソク足と重ならないように)
- 下部テキストオフセット – セッションエリアの下部からの余白を追加
- テキスト時間の位置 – セッション名とともにセッション時間を表示
- 短縮セッション名を使用 – 短い名前に切り替え(例:New Yorkの代わりにNY)
- セッションレンジを表示 – セッションがカバーする価格範囲を強調表示
- セッションレンジモード – 価格範囲の計算方法を選択(高値/安値または始値/終値)
- セッションレンジの位置 – レンジマーカーをレンジの上部か下部に配置
- 高値を表示 – セッションの最高価格を表示
- 高値の位置を表示 – 高値ラベルの表示位置を選択
- 安値を表示 – セッションの最低価格を表示
- 安値の位置を表示 – 安値ラベルの表示位置を選択
- 高値/安値ラインの延長(分) - これらのラインをx分先まで延長可能
- オープニングレンジブレイクアウトを表示 – セッション開始時にブレイクアウトボックスを描画
- ORBラインの延長(分) - これらのラインをx分先まで延長可能
- ミドルラインを表示 – 公正価値を識別するための中間線を追加
- ミドルラインの延長(分) - このラインをx分先まで延長可能
- PoCを表示 – セッションで最も取引された価格(ポイントオブコントロール)を表示
- ミドルラインの延長(分) - このラインをx分先まで延長可能
- 塗りつぶしの透明度 – セッションの背景塗りつぶしの透明度を調整
統計
- 統計の描画 – チャート上の統計パネルの表示/非表示
- 統計の水平配置 – パネルの配置(左 / 中央 / 右)
- 統計の垂直配置 – パネルの表示位置(上または下)を選択
- タイトルカラー – 「統計」タイトルのテキストカラー
- 偶数行の色 – パネル内の偶数行の背景色
- 奇数行の色 – パネル内の奇数行の背景色
- 前景色 – パネル内で使用されるテキストカラー
Telegram
- 使用 – Telegramアラートの有効化または無効化
- トークン – あなたのTelegramボットトークン
- チャットID – アラートが送信されるチャットID
Discord
- 使用 – Discordアラートの有効化または無効化
- WebhookUrl – セッションアラート送信用のDiscordウェブフックURL
サウンドアラート
- 新しいセッションのサウンドアラート – 新しいセッション開始時に音を再生
- セッション完了のサウンドアラート – セッション終了時に音を再生
グリッド
- グリッド強制 - 使用されているタイムフレームに関係なくグリッドの描画を強制
- 指定タイムフレーム以上でグリッド表示 - このタイムフレーム以上でグリッドが表示されるよう選択可能
- メッセージボックス通知 - 通常の描画モードが不可能な理由を通知し、グリッドモードに切り替え
- グリッドの水平配置
- グリッドの垂直配置
セッション例(ニューヨーク)
⚠️ 同じパラメータが各セッション(ロンドン、東京、シドニーなど)に適用されます
- アクティブ – この特定のセッションを有効または無効にする
- 色 – チャート上で使用されるセッションの色
- 領域の塗りつぶし – セッションエリアの背景を塗りつぶす
- ラインスタイル – ラインスタイルを選択(実線、破線など)
- ラインの太さ – セッション境界線の太さを調整
マーケットの時計をあなたの味方にしよう
今すぐMarketSessionsを手に入れて、もう二度と利益の出るセッションを逃さないでください。
概要
Users can view comprehensive session statistics, including total sessions, minimum, average, and maximum ranges measured in ticks, pips, or percentages. A grid mode enables viewing active sessions in a table format suitable for higher timeframes. The indicator supports real-time alerts via Telegram or Discord for session openings, closings, and key levels, complemented by sound and visual notifications.
Additional configurable options include display preferences for session names, price ranges, high/low prices, opening range breakouts, middle lines, and the Point of Control (most traded price). The indicator requires the .NET 6.0 runtime and offers lifetime updates and support. It is applicable to major forex symbols such as EURUSD, GBPUSD, NZDUSD, and USDJPY.
カスタマーレビュー
5 | 100 % | |
4 | 0 % | |
3 | 0 % | |
2 | 0 % | |
1 | 0 % |


![「High-Low Divergence [Iridio Capital]」ロゴ](https://cdn.ctrader.com/image/webp/443c4661-7abb-40f1-842f-4b6ec560649b_40914)


