
Deskripsi
🌐 Perubahan Struktur Pasar – Osilator Struktur Pasar Profesional
Identifikasi Arah Tren Sebenarnya. Saring Kebisingan. Berdagang dengan Percaya Diri.
Perubahan Struktur Pasar adalah osilator tren struktural generasi berikutnya yang dibuat untuk trader yang menginginkan kejelasan, akurasi, dan keandalan dalam semua kondisi pasar.
Alih-alih mengandalkan moving average yang tertinggal atau alat berbasis volatilitas, indikator ini fokus pada inti perilaku harga: puncak ayunan dan lembah ayunan.
Hasilnya adalah model tren yang bersih dan sangat responsif yang membantu Anda langsung mengidentifikasi:
- Bias pasar yang sebenarnya
- Transisi struktur
- Kekuatan kelanjutan tren
- Perubahan momentum tersembunyi
Apakah Anda berdagang ayunan, perdagangan intraday, atau menjalankan sistem algoritmik, Perubahan Struktur Pasar membawa kerangka kerja struktural tingkat profesional langsung ke grafik Anda.
🔥 Mengapa Struktur Pasar Penting
Sebagian besar indikator menganalisis harga setelah harga sudah bergerak.
Struktur pasar bekerja berbeda — ia mengukur dasar perkembangan tren:
- Puncak Lebih Tinggi / Lembah Lebih Tinggi → Struktur bullish
- Puncak Lebih Rendah / Lembah Lebih Rendah → Struktur bearish
Ini mengungkapkan arah yang sedang dibangun pasar, bukan hanya apa yang dilakukan harga dari waktu ke waktu.
Perubahan Struktur Pasar mengotomatisasi seluruh proses ini dan mengubahnya menjadi osilator yang mudah dibaca.
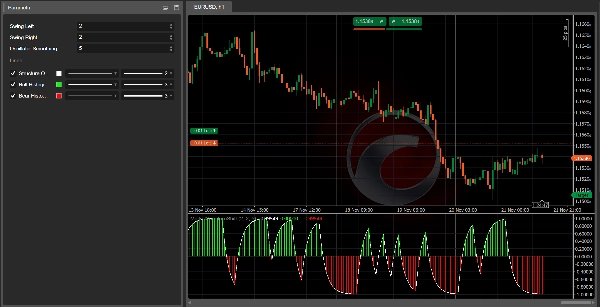
📊 Apa yang Ditampilkan Indikator
✔ 1. Garis Osilator Struktur (Putih)
Garis tren berbasis EMA yang dihaluskan yang dengan jelas menampilkan struktur dominan:
- Di atas 0 → Struktur bullish
- Di bawah 0 → Struktur bearish
- Dekat 0 → Ketidakstabilan struktur atau transisi tren
Sekilas menunjukkan di mana posisi pasar sebenarnya.
✔ 2. Histogram Bullish (Hijau)
Menampilkan kekuatan dan momentum dalam struktur bullish.
Batang yang lebih kuat = tekanan naik yang lebih kuat.
Sempurna untuk mengonfirmasi setup beli.
✔ 3. Histogram Bearish (Merah)
Menunjukkan momentum dan kekuatan struktur bearish.
Batang yang lebih kuat = tren turun yang lebih kuat.
Ideal untuk memvalidasi peluang jual.
🎯 Cara Trader Menggunakannya (Alur Kerja Profesional)
A. Filter Konfirmasi Tren
Hanya berdagang sesuai arah momentum struktural:
- Perdagangan beli saat osilator di atas 0
- Perdagangan jual saat osilator di bawah 0
Aturan sederhana ini saja menghilangkan banyak setup palsu.
B. Deteksi Pembalikan Struktural
Transisi besar terlihat saat osilator melintasi garis nol:
- Merah → Hijau = Struktur bullish baru
- Hijau → Merah = Struktur bearish baru
Ini memberikan wawasan awal tentang pergeseran tren jauh sebelum alat tradisional bereaksi.
C. Optimasi Multi-Timeframe
Indikator ini sangat kuat dalam alur kerja MTF:
- Gunakan H4/H1 untuk kerangka tren
- Gunakan M30/M15 untuk entri
Mencegah perdagangan melawan tren dan memaksimalkan akurasi.
D. Sinergi dengan Sinyal Struktur Pasar
Perubahan Struktur Pasar menjadi sistem perdagangan lengkap ketika digabungkan dengan Sinyal Struktur Pasar, yang menyediakan:
- Panah BELI/JUAL
- Penanda pergeseran visual
- Peringatan pelanggaran struktural
Bersama-sama mereka menciptakan metodologi berbasis struktur dari atas ke bawah yang lengkap.
⚙️ Dirancang untuk Semua Pasar
✔ Forex
✔ Indeks
✔ Kripto
✔ Logam
✔ Pasar sintetis
✔ Futures (melalui proxy CFD)
Sangat dapat disesuaikan berkat kontrol parameter atas:
- Deteksi ayunan
- Kekuatan penghalusan
- Sensitivitas terhadap perubahan struktural
📈 Pengaturan yang Direkomendasikan
- Ayunan Kiri/Kanan: 2–3 untuk Forex dan Indeks, 3–3 untuk Kripto
- Penghalusan Osilator: 5–8 untuk responsivitas seimbang
Dibangun untuk langsung digunakan, tetapi sepenuhnya dapat disesuaikan.
💬 Bergabunglah dengan Komunitas Kami untuk Alat & Optimasi Gratis
Klik tautan di profil saya untuk bergabung dengan komunitas perdagangan kami, di mana Anda akan menemukan:
- Set parameter yang dioptimalkan
- Alat tambahan
- Strategi berbasis struktur
- Sumber daya eksklusif untuk indikator AlgoTrend
Tempat yang bagus untuk mengembangkan sistem Anda dan meningkatkan konsistensi.
Ringkasan
Traders use Market Structure Shift for trend confirmation by trading only in the direction of structural momentum, detecting structural reversals via zero-line crossings, and optimizing multi-timeframe workflows (e.g., H4/H1 for trend framework, M30/M15 for entries). It integrates with Market Structure Signals to provide buy/sell arrows, visual shift markers, and structural break alerts, forming a comprehensive structure-based trading system.
The indicator supports multiple markets including Forex, indices, cryptocurrencies, metals, synthetic markets, and futures (via CFDs). It offers customizable parameters for swing detection, smoothing, and sensitivity to structural changes, enabling adaptability across different asset classes and trading styles.
Ulasan pelanggan
5 | 0 % | |
4 | 100 % | |
3 | 0 % | |
2 | 0 % | |
1 | 0 % |


