

説明
Crosshair Edge: 最高のcTraderデータ可視化ツール
強力なツールであるCrosshair Edgeを使えば、cTraderプラットフォーム内の市場データの可視化を向上させ、チャート分析を新たな高みへ引き上げることができます。
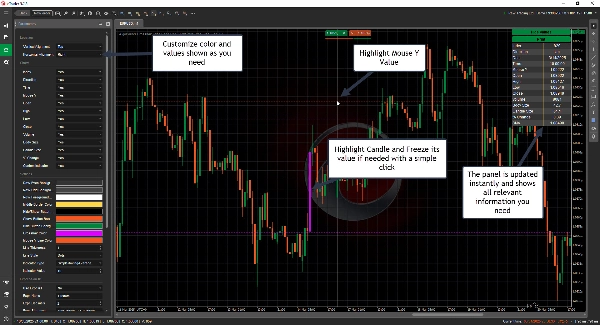
強化されたチャート操作
- 現在のバーとその範囲をハイライト
- クリックで特定のローソク足にクロスヘアを固定し、必要に応じて再度クリックで解除
- 値をログに送信して簡単にコピー可能に
- 必要に応じてレイアウトの表示・非表示を切り替え
完全なカスタマイズ
- 色を自分のスタイルに合わせてパーソナライズ
- チャート内の任意の場所にクロスヘアを調整可能
- 表示する値と省略する値を選択可能
瞬時のローソク足データ表示
任意のローソク足にカーソルを合わせるだけで、その詳細などをすべて確認可能
- インデックス
- 方向
- 日付
- 時間
- マウスY価格
- 始値
- 高値
- 安値
- 終値
- 出来高
- 実体サイズ
- ローソク足サイズ
- 変化率%
- 複数のインジケーター値
-
- ADX
- ATR
- チャイキンマネーフロー
- EMA、HMA、SMA、TSMA、TMA、WMA
- オンバランスボリューム
- RSI
- STD
- 加重終値
- ウェルズワイルダー平滑化
- ウィリアムズ%R
- 簡単なホットキーで水平線/垂直線を描画
-
- 水平線を描く: Ctrl + 1
- 垂直線を描く: Ctrl + 2
- ホットキーは完全にカスタマイズ可能
- カスタマイズ可能な数式
-
- 始値、高値、安値、終値、インデックスを使ってニーズに合った数式を計算
- 例:典型価格:(High[index] + Low[index] + Close[index])/3.0
シームレスな統合
- cTrader IDにリンクされたライセンスで使いやすさ向上
- 今後のアップデートも含む
今すぐCrosshair Edgeでトレーディング体験をアップグレードしましょう! 🚀
概要
AI summary
AlgoCorner Crosshair Edge is a data visualization indicator designed for the cTrader platform to enhance chart analysis and market data interaction. It highlights the current bar and its range, allows users to freeze the crosshair on a specific candle with a click, and unlock it as needed. Users can send values to a log for easy copying and toggle the layout display.
The tool offers full customization, including color personalization, adjustable crosshair positioning within the chart, and selective display of data values. Instant candle data is available by hovering over any candle, showing details such as index, direction, date, time, mouse Y price, open, high, low, close, volume, body size, candle size, percentage change, and multiple indicator values (e.g., ADX, ATR, Chaikin Money Flow, various moving averages, RSI, and others).
Crosshair Edge supports drawing horizontal and vertical lines using customizable hotkeys (default: Ctrl+1 for horizontal, Ctrl+2 for vertical). It also allows users to create custom formulas based on open, high, low, close, and index values for tailored calculations.
The license is linked to the user’s cTrader ID for seamless integration, and future updates are included. This tool is intended to improve precision and efficiency in market data visualization within cTrader.
The tool offers full customization, including color personalization, adjustable crosshair positioning within the chart, and selective display of data values. Instant candle data is available by hovering over any candle, showing details such as index, direction, date, time, mouse Y price, open, high, low, close, volume, body size, candle size, percentage change, and multiple indicator values (e.g., ADX, ATR, Chaikin Money Flow, various moving averages, RSI, and others).
Crosshair Edge supports drawing horizontal and vertical lines using customizable hotkeys (default: Ctrl+1 for horizontal, Ctrl+2 for vertical). It also allows users to create custom formulas based on open, high, low, close, and index values for tailored calculations.
The license is linked to the user’s cTrader ID for seamless integration, and future updates are included. This tool is intended to improve precision and efficiency in market data visualization within cTrader.
インジケーターのプロフィール
カスタマーレビュー
5.0
レビュー: 2
5 | 100 % | |
4 | 0 % | |
3 | 0 % | |
2 | 0 % | |
1 | 0 % |
カスタマーレビュー
April 23, 2025
ディスカッション
よくあるご質問
Indices
RSI
ATR
cTrader Storeで入手可能な取引ボット、インジケーター、プラグインなどの商品は、第三者の開発者が提供するものであり、情報と技術の取得のみを目的としてご利用いただけます。cTrader Storeはブローカーではなく、投資助言や個人的な推奨を行うことも、将来のパフォーマンスを保証することもありません。










![「[CB] Pivot Points Pro」ロゴ](https://cdn.ctrader.com/image/webp/43463c82-67b0-4f10-a4ba-901bba091d81_32594)













価格
12
販売
414
無料インストール