
Beschreibung
MarketSessions – Ihr Trading-Vorteil, visualisiert
Verwandeln Sie Marktzeiten in Trading-Power
MarketSessions ist ein professioneller cTrader-Indikator, der globale Marktsitzungen zum Leben erweckt – damit Sie dort handeln können, wo Momentum real ist und Timing zu Ihrem Vorteil wird.
🚀 Warum Trader MarketSessions vertrauen
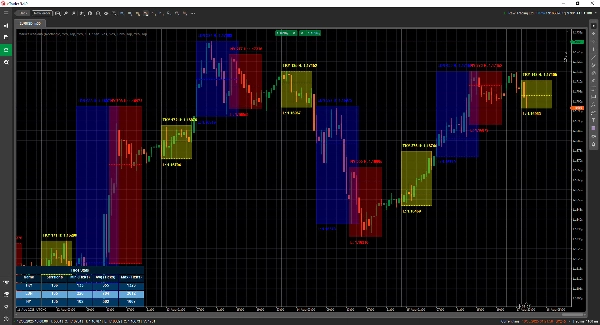
Sehen Sie den Marktrhythmus
Visualisieren Sie sofort London, New York, Tokio, Sydney – und jede andere Sitzung, die Sie möchten – mit klaren, eleganten Overlays, die sich an Ihr Chart anpassen.
Handeln intelligenter, nicht später
Erhalten Sie Echtzeit-Benachrichtigungen, wenn Sitzungen öffnen, schließen oder wichtige Levels erreichen – geliefert über Telegram oder Discord (Ihre Wahl).
Greifen Sie Hochwahrscheinlichkeitszonen an
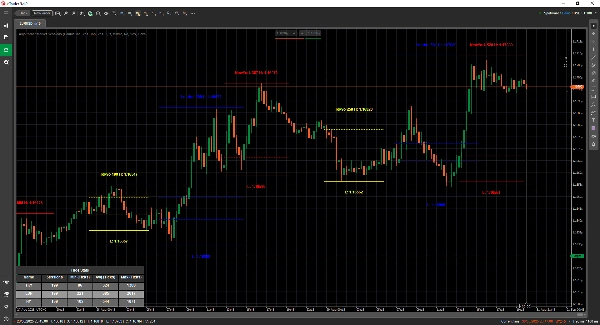
Nutzen Sie integrierte Werkzeuge wie den Opening Range Breakout, Point of Control (POC) und präzise Sitzungs-Linien, damit Sie keinen Ausbruch oder Abpraller verpassen.
🎯 Hauptmerkmale
- Sitzungsvisualisierung & -verwaltung – vollständig anpassbare Zeiten, Farben und Beschriftungen, auch für sich überlappende Märkte
- Erweiterte Zeichenwerkzeuge – beinhaltet Double ❘❘ und Mittellinien-Zeichner, Ausbruchsrechtecke, Textmarker und einen Double Line Mode für minimalistische Trader
- Statistik-Panel – Anzeige von Gesamt-Sitzungen, Min, Durchschnitt und Max Reichweiten für jede Sitzung (in Ticks, Pips oder %)
- Grid-Modus - ermöglicht die Ansicht der aktuell aktiven Sitzungen in einer Tabelle, sodass Sie die Sitzungen in einem höheren Zeitrahmen sehen können.
- Flexible Konfiguration – passen Sie Textplatzierung, Reichweitenmodi, Zeichenpräferenzen und Themen an
- Alarme & Integrationen – Telegram/Discord-Integration mit Ton- und visuellen Alarmen
📦 Was Sie erhalten
- MarketSessions.algo (einsatzbereit)
- Lebenslange Updates (keine wiederkehrenden Gebühren)
- Freundlicher Support (direkter Zugang, falls Sie Hilfe benötigen)
💻 Anforderungen
- cTrader-Plattform
- .NET 6.0 Laufzeit
✅ Installation in Minuten
✅ Handeln Sie mit absolutem Vertrauen
📘 Parameterreferenz (freundliche Version)
Liste der verfügbaren Sitzungen
- New York
- London
- Frankfurt
- Tokio
- Hongkong
- Shanghai
- Singapur
- Wellington
- Sydney
- Toronto
Allgemeine Einstellungen
- Zeichenmodus – Wählen Sie, wie Sitzungs-Linien im Chart gezeichnet werden (Rechteck / Doppellinie / Mittellinie)
- Sitzungsname anzeigen – Zeigt den Namen jeder Sitzung direkt im Chart an
- Position des Sitzungsnamens – Legen Sie fest, wo der Sitzungsname erscheint (oben, Mitte, unten)
- Fetter Text – Macht den Sitzungsnamen fett, damit er leichter lesbar ist
- Abstand oben beim Text – Fügt zusätzlichen Abstand von oben hinzu (damit sich der Text nicht mit Kerzen überlappt)
- Abstand unten beim Text – Fügt zusätzlichen Abstand vom unteren Bereich der Sitzung hinzu
- Position der Zeitangabe im Text – Zeigt die Sitzungszeit zusammen mit dem Sitzungsnamen an
- Kurze Sitzungsnamen verwenden – Wechselt zu kürzeren Namen (z. B. NY statt New York)
- Sitzungsbereich anzeigen – Hebt die gesamte Preisspanne hervor, die von der Sitzung abgedeckt wird
- Modus für Sitzungsbereich – Wählen Sie, wie die Preisspanne berechnet wird (hoch/tief oder offen/geschlossen)
- Position des Bereichsmarkers – Platzieren Sie den Bereichsmarker entweder oben oder unten im Bereich
- Hoch anzeigen – Zeigt den höchsten Preis der Sitzung an
- Position des Hoch-Labels – Wählen Sie, wo das Hoch-Label erscheint
- Tief anzeigen – Zeigt den niedrigsten Preis der Sitzung an
- Position des Tief-Labels – Wählen Sie, wo das Tief-Label erscheint
- Hoch-/Tief-Linien verlängern (Minuten) - Ermöglicht das Verlängern dieser Linien um x Minuten nach vorne
- Opening Range Breakout anzeigen – Zeichnet ein Ausbruchsrechteck beim Sitzungsbeginn
- ORB-Linien verlängern (Minuten) - Ermöglicht das Verlängern dieser Linien um x Minuten nach vorne
- Mittellinien anzeigen – Fügt Mittellinien hinzu, um den fairen Wert zu identifizieren
- Mittellinien verlängern (Minuten) - Ermöglicht das Verlängern dieser Linie um x Minuten nach vorne
- PoC anzeigen – Zeigt den Point of Control (am meisten gehandelte Preis der Sitzung) an
- Mittellinien verlängern (Minuten) - Ermöglicht das Verlängern dieser Linie um x Minuten nach vorne
- Transparenz der Füllung – Steuert, wie transparent die Hintergrundfüllung der Sitzung ist
Statistiken
- Statistiken zeichnen – Zeigt/verbirgt das Statistik-Panel in Ihrem Chart
- Horizontale Ausrichtung der Statistiken – Ausrichtung des Panels (Links / Mitte / Rechts)
- Vertikale Ausrichtung der Statistiken – Wählen Sie, ob das Panel oben oder unten erscheint
- Titel-Farbe – Textfarbe für den Titel „Statistiken“
- Farbe für gerade Zeilen – Hintergrundfarbe für gerade nummerierte Zeilen im Panel
- Farbe für ungerade Zeilen – Hintergrundfarbe für ungerade nummerierte Zeilen im Panel
- Vordergrundfarbe – Textfarbe, die im Panel verwendet wird
Telegram
- Verwenden – Telegram-Alarme aktivieren oder deaktivieren
- Token – Ihr Telegram-Bot-Token
- ChatId – Die Chat-ID, an die Alarme gesendet werden
Discord
- Verwenden – Discord-Alarme aktivieren oder deaktivieren
- WebhookUrl – Discord-Webhook-URL zum Senden von Sitzungsalarmen
Sound-Alarme
- Neuer Sitzungs-Soundalarm – Spielt einen Ton ab, wenn eine neue Sitzung beginnt
- Sitzung abgeschlossen Soundalarm – Spielt einen Ton ab, wenn eine Sitzung endet
Grid
- Grid erzwingen - Erzwingt die Darstellung des Grids unabhängig vom verwendeten Zeitrahmen
- Grid sichtbar ab Zeitrahmen - Ermöglicht die Auswahl, ab welchem Zeitrahmen dieses Grid sichtbar ist
- Nachricht im Benachrichtigungsfenster - Informiert, warum der normale Darstellungsmodus nicht möglich ist und auf den Grid-Modus umgeschaltet wird
- Horizontale Ausrichtung des Grids
- Vertikale Ausrichtung des Grids
Sitzungsbeispiel (New York)
⚠️ Die gleichen Parameter gelten für jede Sitzung (London, Tokio, Sydney usw.)
- Aktiv – Diese spezifische Sitzung aktivieren oder deaktivieren
- Farbe – Sitzungsfarbe, die im Chart verwendet wird
- Bereich füllen – Füllt den Hintergrund des Sitzungsbereichs
- Linienstil – Wählen Sie den Linienstil (durchgezogen, gestrichelt usw.)
- Linienstärke – Steuert die Dicke der Sitzungsränder
Machen Sie die Uhr des Marktes zu Ihrem Verbündeten
Holen Sie sich noch heute MarketSessions und verpassen Sie nie wieder eine profitable Sitzung.
Zusammenfassung
Users can view comprehensive session statistics, including total sessions, minimum, average, and maximum ranges measured in ticks, pips, or percentages. A grid mode enables viewing active sessions in a table format suitable for higher timeframes. The indicator supports real-time alerts via Telegram or Discord for session openings, closings, and key levels, complemented by sound and visual notifications.
Additional configurable options include display preferences for session names, price ranges, high/low prices, opening range breakouts, middle lines, and the Point of Control (most traded price). The indicator requires the .NET 6.0 runtime and offers lifetime updates and support. It is applicable to major forex symbols such as EURUSD, GBPUSD, NZDUSD, and USDJPY.
Kundenbewertungen
5 | 100 % | |
4 | 0 % | |
3 | 0 % | |
2 | 0 % | |
1 | 0 % |


