
AlgoCorner Crosshair Edge
Indikator
Version 1.0, Apr 2025
Windows, Mac
5.0
Bewertungen: 1
Beschreibung
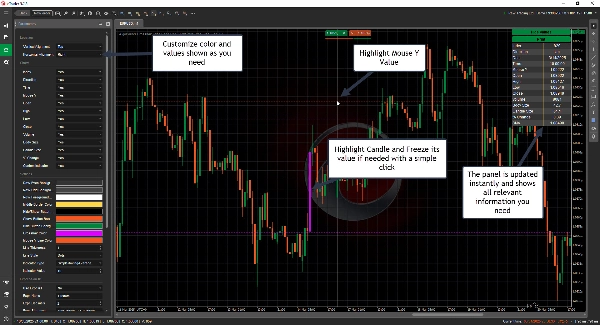
Crosshair Edge: Das beste cTrader-Datenvisualisierungstool
Mit Crosshair Edge, einem robusten Tool, das die Visualisierung von Marktdaten innerhalb der cTrader-Plattform verbessert, können Sie Ihre Chartanalyse auf ein neues Niveau heben.
Verbesserte Chart-Interaktion
- Hervorheben der aktuellen Kerze und ihres Bereichs
- Fixieren des Fadenkreuzes auf einer bestimmten Kerze mit einem Klick und bei Bedarf erneut mit einem Klick entsperren
- Werte an Ihr Protokoll senden, damit sie leicht kopiert werden können
- Layout nach Bedarf anzeigen oder ausblenden
Volle Anpassung
- Personalisieren Sie die Farben nach Ihrem Stil
- Passen Sie das Fadenkreuz an jede gewünschte Position im Chart an
- Wählen Sie aus, welche Werte angezeigt und welche weggelassen werden sollen
Sofortige Kerzendatenanzeige
Bewegen Sie einfach den Mauszeiger über eine Kerze, um alle Details und mehr zu sehen
- Index
- Richtung
- Datum
- Zeit
- Maus Y Preis
- Eröffnung
- Hoch
- Tief
- Schluss
- Volumen
- Körpergröße
- Kerzengröße
- % Veränderung
- Mehrere Indikatorwerte
-
- ADX
- ATR
- Chaikin Money Flow
- EMA, HMA, SMA, TSMA, TMA, WMA
- On Balance Volume
- RSI
- STD
- Gewichteter Schluss
- Welles Wilder Glättung
- Williams %R
- Zeichnen Sie horizontale/vertikale Linien mit einfachen Hotkeys
-
- Horizontale Linie zeichnen: Strg + 1
- Vertikale Linie zeichnen: Strg + 2
- Hotkeys vollständig anpassbar
- Anpassbare Formeln
-
- Verwenden Sie Open, High, Low, Close und Index, um Formeln zu berechnen, die Ihren Bedürfnissen entsprechen
- Beispiel, Typischer Preis: (High[index] + Low[index] + Close[index])/3.0
Nahtlose Integration
- Lizenz verknüpft mit Ihrer cTrader-ID für einfache Nutzung
- Zukünftige Updates inklusive
Verbessern Sie noch heute Ihr Handelserlebnis mit Crosshair Edge! 🚀
Zusammenfassung
Indikatorprofil
Kundenbewertungen
5.0
Bewertungen: 1
5 | 100 % | |
4 | 0 % | |
3 | 0 % | |
2 | 0 % | |
1 | 0 % |
Kundenbewertungen
Diskussion
Häufig gestellte Fragen (FAQ)
Indices
RSI
ATR
Über den cTrader Store verfügbare Produkte, einschließlich Handelsbots, Indikatoren und Plugins, werden von externen Entwicklern bereitgestellt und nur zu Informations- und technischen Zugriffszwecken verfügbar gemacht. cTrader Store ist kein Broker und erbringt keine Anlageberatung, persönlichen Empfehlungen oder eine Garantie für zukünftige Performance.


![„[Stellar Strategies] MARSI Signal Plotter“-Logo](https://cdn.ctrader.com/image/webp/7b2b8da6-8f8e-4646-8d4a-4710c516c01e_25567)


![„[Hamster-Coder] Moving Average MTF“-Logo](https://cdn.ctrader.com/image/webp/b11b98b1-194d-4b8e-b00e-d611826ad159_31226)


Preis
10
Verkäufe
342
Kostenlose Installationen