
Açıklama
Coppock Eğrisi Nedir?
Coppock Eğrisi, orijinal olarak S&P 500'de büyük piyasa diplerini belirlemek için tasarlanmış uzun vadeli bir momentum göstergesidir. 1962 yılında, Episcopal Church tarafından bağışları için düşük riskli alım fırsatları bulması istenen ekonomist Edwin Coppock tarafından oluşturulmuştur.
Basitçe söylemek gerekirse, ayı piyasasının muhtemelen dip yaptığı ve yeni bir boğa piyasasının başladığını size söyleyen bir trend takipçisi osilatördür.
“Gizli Sos” (Nasıl Çalışır)
Tepkisel ve ani hareket eden birçok göstergenin aksine, Coppock Eğrisi kasıtlı olarak yavaştır. İki farklı Değişim Oranı'nın (ROC) toplamının Ağırlıklı Hareketli Ortalaması (WMA) alınarak hesaplanır.
Coppock = WMA(10) of (ROC(14) + ROC(11))
Mantık:
Fiyat momentumunun uzun dönemlerde (genellikle 11 ve 14 ay) nasıl değiştiğini ölçer. Bu veriyi ağırlıklı ortalama ile yumuşatarak, kısa vadeli piyasa gürültüsünün neredeyse tamamını filtreler.
Eğlenceli Bilgi:
Coppock, piskoposlara bir kişinin sevdiği birini kaybetmenin üzüntüsünden ne kadar sürede kurtulduğunu sormuş. Onlar “11 ila 14 ay” demişler. Coppock, bu aynı zaman dilimlerini piyasaya uygulamış ve piyasa psikolojisinin benzer bir yas ve iyileşme döngüsünü takip ettiğini düşünmüştür.
Neden Faydalıdır?
Tüccarlar ve yatırımcılar Coppock Eğrisini üç ana nedenle severler:
- Gürültüyü Filtreler: Çünkü geleneksel olarak aylık zaman dilimlerinde hesaplanır, günlük veya haftalık volatiliteyi görmezden gelir. Sıklıkla tetiklenmez, ancak tetiklendiğinde genellikle önemlidir.
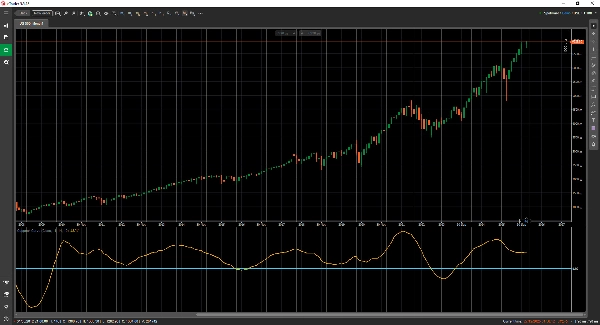
- Net Alım Sinyalleri: Sinyal ikili ve okunması kolaydır. Eğri sıfır çizgisinin altında iken yukarı yönlü döndüğünde (“yükselmeye başladığında”) bir “Al” sinyali üretilir.
- Psikolojik Çapa: “Düşen bıçağı yakalamaya” çalışmanızı engeller. Pozisyona girmeden önce momentumun matematiksel olarak negatiften pozitife kaymasını beklemenizi sağlar.
Ne Zaman Kullanılır
- En İyi Kullanım: Uzun vadeli yatırım, emeklilik tahsisleri ve yeni bir boğa koşusunun başlangıcını belirlemek için.
- Uygun Değil: Gün içi işlem veya açığa satış için. Satış sinyalleri veya piyasa zirvelerini belirlemek için tasarlanmamıştır.


