
AlgoCorner Crosshair Edge
Gösterge
Sürüm 1.0, Apr 2025
Windows, Mac
5.0
Değerlendirmeler: 1
Açıklama
Crosshair Edge: En İyi cTrader Veri Görselleştirme Aracı
İle Crosshair Edge, cTrader platformu içindeki piyasa verilerinin görselleştirilmesini geliştiren güçlü bir araç, grafik analizlerinizi yeni seviyelere taşıyabilirsiniz.
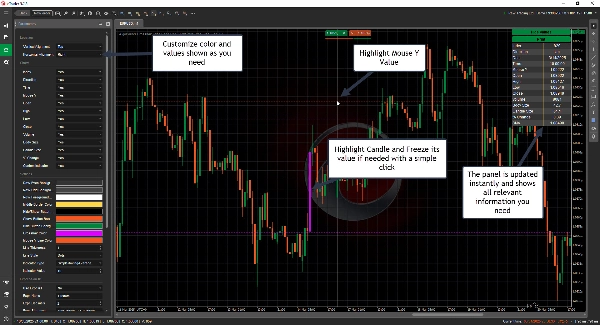
Gelişmiş Grafik Etkileşimi
- Mevcut çubuğu ve aralığını vurgulayın
- Bir mum üzerinde tıklayarak imleci dondurun ve gerektiğinde tekrar tıklayarak açın
- Değerleri kolayca kopyalanabilmesi için logunuza gönderin
- İhtiyaç duyulduğunda düzeni gösterin veya gizleyin
Tam Özelleştirme
- Renkleri tarzınıza göre kişiselleştirin
- İmleci grafikte ihtiyacınız olan herhangi bir konuma ayarlayın
- Hangi değerlerin gösterileceğini ve hangilerinin atlanacağını seçin
Anında Mum Verisi Gösterimi
Herhangi bir mumun üzerine gelerek tüm detaylarını ve daha fazlasını kontrol edin
- İndeks
- Yön
- Tarih
- Saat
- Fare Y Fiyatı
- Açılış
- Yüksek
- Düşük
- Kapanış
- Hacim
- Gövde Boyutu
- Mum Boyutu
- % Değişim
- Birden fazla gösterge değeri
-
- ADX
- ATR
- Chaikin Para Akışı
- EMA, HMA, SMA, TSMA, TMA, WMA
- Denge Hacmi
- RSI
- STD
- Ağırlıklı Kapanış
- Welles Wilder Yumuşatma
- Williams %R
- Kolay kısayollarla Yatay/Dikey Çizgiler Çizin
-
- Yatay Çizgi Çiz: Ctrl + 1
- Dikey Çizgi Çiz: Ctrl + 2
- Kısayollar tamamen özelleştirilebilir
- Özelleştirilebilir Formüller
-
- İhtiyaçlarınıza uygun formüller hesaplamak için Açılış, Yüksek, Düşük, Kapanış ve İndeksi kullanın
- Örnek, Tipik Fiyat: (Yüksek[indeks] + Düşük[indeks] + Kapanış[indeks])/3.0
Sorunsuz Entegrasyon
- Kullanım kolaylığı için lisansınız cTrader ID'nize bağlıdır
- Gelecekteki güncellemeler dahildir
Ticaret deneyiminizi bugün Crosshair Edge ile yükseltin! 🚀
Özet
Gösterge profili
Müşteri değerlendirmeleri
5.0
Değerlendirmeler: 1
5 | 100 % | |
4 | 0 % | |
3 | 0 % | |
2 | 0 % | |
1 | 0 % |
Müşteri değerlendirmeleri
Tartışma
SSS
Indices
RSI
ATR
cTrader Store üzerinden erişilebilen işlem botları, göstergeler ve eklentiler gibi ürünler, üçüncü taraf sağlayıcılar tarafından sağlanır ve yalnızca bilgilendirme ve teknik erişim amaçlarıyla sunulur. cTrader Store bir broker değildir ve yatırım tavsiyesi, kişisel öneriler vermez veya gelecekteki performansı garanti etmez.


Fiyat
10
Satışlar
346
Ücretsiz yüklemeler