
説明
究極のローソク足スイートは、今日存在するほとんどのローソク足パターンを検出するのに役立ちます。
ローソク足パターンは、テクニカル取引ツールであり、価格の方向性を予測するために何世紀にもわたって使用されてきました。価格の方向性と勢いを判断するために使用されるさまざまなローソク足パターンがあり、スリーラインストライク、ツーレッドギャッピング、スリーレッドクロウ、イブニングスター、アバンドンドベイビーなどがあります。
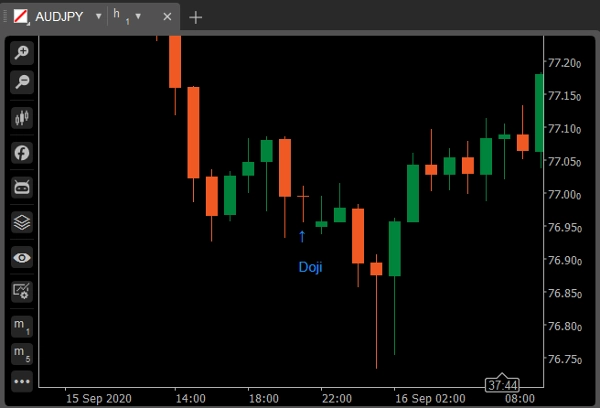
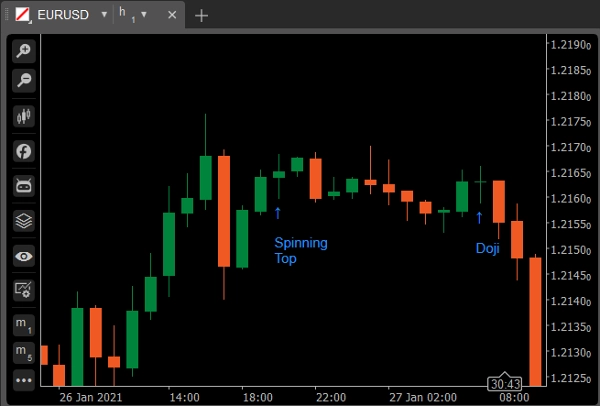
ドージー
ドージーのローソク足は、ある期間の始値と終値がほぼ同じで形成され、一般的にテクニカルアナリストにとって反転パターンを示します。実体の閾値は全長の最大5%です。
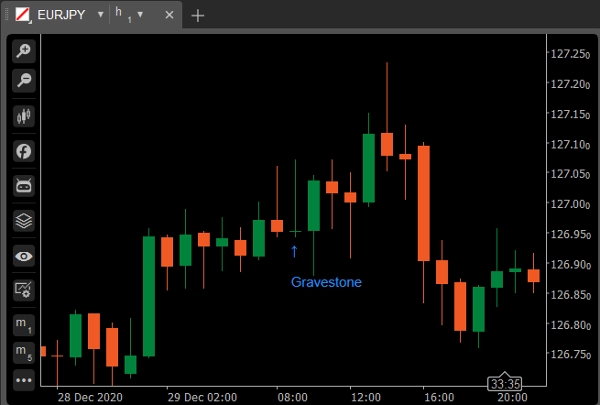
バリエーション:グレイブストーンドージー
資産の高値、始値、終値が(ほぼ)同じときに形成されます。長い下ヒゲは、その期間中に積極的な売りがあったことを示しますが、価格が始値近くで終わったため、買い手が売りを吸収して価格を押し戻したことを示しています。
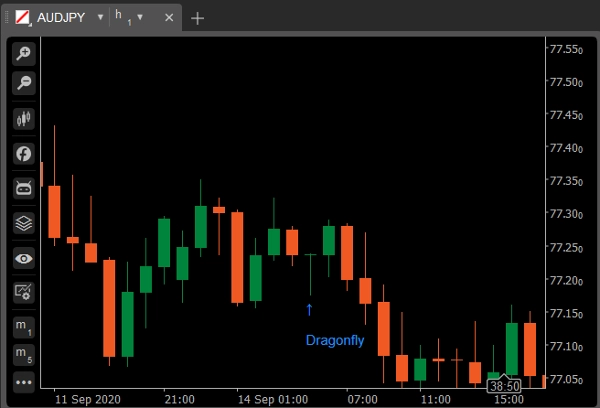
バリエーション:ドラゴンフライドージー
グレイブストーンドージーは、安値、始値、終値が(ほぼ)同じで、ローソク足に長い上ヒゲがある場合に発生します。グレイブストーンは逆さの「T」のように見えます。グレイブストーンの意味合いはドラゴンフライと同じで、どちらもトレンドの反転の可能性を示しますが、次のローソク足で確認する必要があります。
スピニングトップ
スピニングトップは、上下に長いヒゲがあり、その間に短い実体が垂直に中央に位置するローソク足パターンです。このパターンは資産の将来の方向性に関する迷いを表し、買い手も売り手も優位に立てなかったことを示します。実体の閾値は全長の最大20%です。
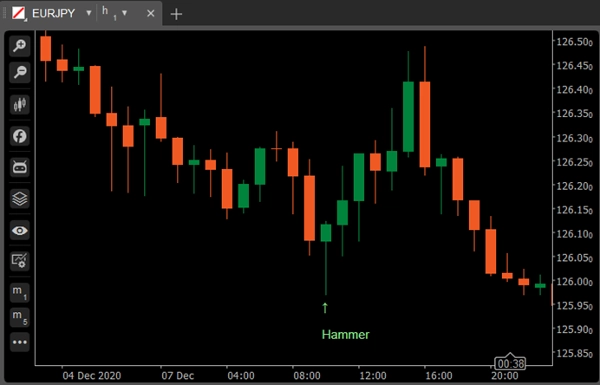
ハンマー
ハンマーは、上ヒゲがほとんどまたは全くなく、上部近くに小さな実体を持ち、長い下ヒゲを持つ緑または赤のローソク足です。下降トレンド中の強気パターンと見なされます。
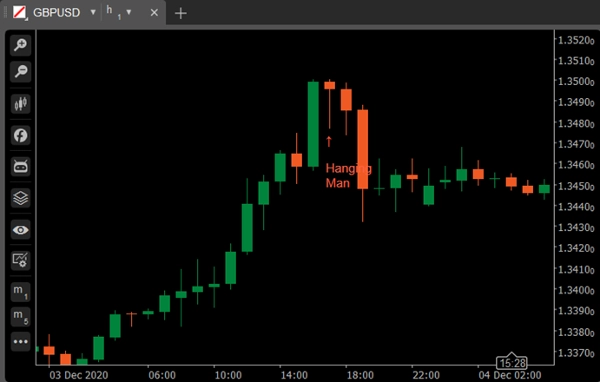
バリエーション:ハンギングマン
ハンギングマンは、上ヒゲがほとんどまたは全くなく、上部近くに小さな実体を持ち、長い下ヒゲを持つ緑または赤のローソク足です。上昇トレンド中の弱気パターンと見なされます。
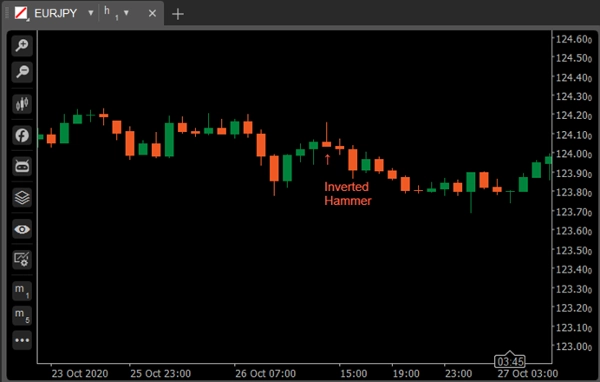
インバーテッドハンマー
インバーテッドハンマーは下降トレンドの後に見られるローソク足パターンの一種で、通常はトレンド反転のシグナルとされます。
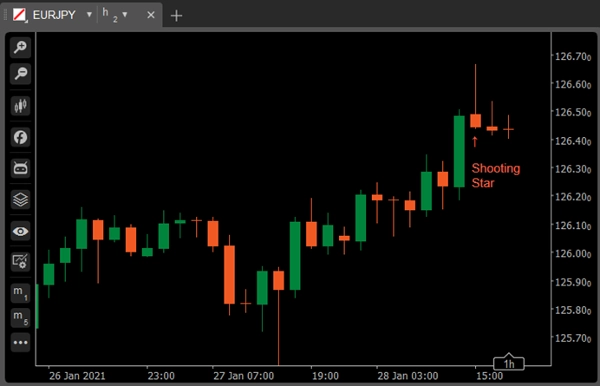
バリエーション:シューティングスター
シューティングスターはインバーテッドハンマーとまったく同じ見た目ですが、下降トレンドではなく上昇トレンドで見られ、そのため異なる意味合いを持ちます。
マルボズ
影やヒゲのない長いまたは通常のローソク足(赤または緑)。高値と安値が始値と終値を表します。継続パターンと見なされます。
バリエーション:マルボズオープン
マルボズオープンの場合、始値はフラットであるべきです。つまり、価格の動きは一方向のみですが、マルボズフルキャンドルとは異なり、終値は高値/安値からわずかに異なることがあります。言い換えれば、始値はフラットであり、反対側に短いヒゲの余地があります。
バリエーション:マルボズクローズ
マルボズクローズキャンドルはマルボズオープンの逆で、終値はフラットであるべきですが、価格の動きは一方向に積極的に取引され始める前にわずかに反対方向に動くことがあります。
強気包み足
小さな赤い実体が次の大きな緑のローソク足に包まれているパターン。底で現れると大きな反転シグナルと解釈されます。
弱気包み足
小さな緑の実体が次の大きな赤のローソク足に包まれているパターン。頂点で現れると大きな反転シグナルと見なされます。
ピアシングライン
赤いローソク足の後に、前の安値より低く始まり、赤い実体の半分以上を超えて終わる緑のローソク足が続くパターン。底で現れると反転シグナルと見なされます。
ダークシャドウカバー
長い緑のローソク足の後に、緑の高値を上回って始まり、緑の実体の中に十分に終わる赤いローソク足が続くパターン。上昇トレンド中の弱気反転シグナルと見なされます。
強気ハラミ
異常に大きな赤い実体の後に、小さな緑の実体が続き(大きな赤い実体内に収まる)、下降トレンドの後に現れると強気パターンと見なされます。
バリエーション:強気ハラミクロス
大きな赤い実体の後にドージーが続くパターン。底で現れると反転シグナルと見なされます。
弱気ハラミ
異常に大きな緑の実体の後に、小さな赤い実体が続き(大きな緑の実体内に収まる)、上昇トレンドの後に現れると弱気パターンと見なされます。
バリエーション:弱気ハラミクロス
大きな緑の実体の後にドージーが続くパターン。頂点で現れると反転シグナルと見なされます。
強気/弱気キッカー
強気キッカーシグナルは、市場時間の前後に発表される大きなニュースの驚きの後にしばしば発生します。何か劇的なことが起こり、投資家のセンチメントに大きな変化をもたらし、反転が必然的に続きます。2つのローソク足のギャップが大きいほど、シグナルはより重要です。
モーニング/イブニングスター
大きな緑の実体のローソク足の後に、小さな実体のローソク足(赤または緑)が前のローソク足の上にギャップを空けて続きます。3番目は大きな緑の実体の中に十分に終わる赤い実体のローソク足です。頂点で現れると反転シグナルと見なされます。
バリエーション:アバンドンドベイビー
スリーグリーンソルジャーズ/スリーレッドクロウ
連続して高値で終わる3本の長い緑のローソク足で構成されます。終値は高値近くか高値にあります。底で現れると底の反転シグナルと解釈されます。
連続して安値で終わる3本の長い赤のローソク足で構成されます。終値は安値近くか安値にあります。頂点で現れると頂点の反転シグナルと見なされます。
スリーラインストライク
スリーラインストライクは、トレンドの方向に3本のローソク足が続き、最後のローソク足が開始点まで戻る継続パターングループです。トレーダーはスリーラインストライクを最近のトレンドの安値で買うか、最近の高値で売る機会として利用します。
ツーレッドギャッピング
弱気のツーレッドギャッピング継続パターンは、上昇トレンドの顕著な頂点の後に現れ、ギャップダウンして2本の赤いバーがより低い安値を記録します。このパターンは下落がさらに低い安値まで続くことを予測します。
概要
カスタマーレビュー
5 | 100 % | |
4 | 0 % | |
3 | 0 % | |
2 | 0 % | |
1 | 0 % |


![「High-Low Divergence [Iridio Capital]」ロゴ](https://cdn.ctrader.com/image/webp/443c4661-7abb-40f1-842f-4b6ec560649b_40914)


