
VIX - volatility indicator
インジケーター
2 購入済
バージョン 1.2、Apr 2026
Windows、Mac
4.5
レビュー: 2
説明
この独自のVIXインジケーターは、Average True Range(ATR)を活用しており、市場のボラティリティを正確かつ明確に分析し、cTrader 5.5.13+. に最適化されています。スケールされたVIXの動きと出来高分析を組み合わせて、主要な変化や潜在的なブレイクアウトを確認します。
主な特徴とコード品質
- バグ・警告ゼロ: 最新のcTrader APIに完全にリファクタリングされており、すべてのレガシーエラーと警告を排除し、最大の安定性とパフォーマンスを実現しています。
- ATRベースのVIX: ボラティリティの応答性の高い指標を提供し、極端な市場状況に正規化されています。
- 二重確認: ボラティリティ(VIXライン)とティックボリュームデータを組み合わせて、高確率のブレイクアウトアラートを検証します。
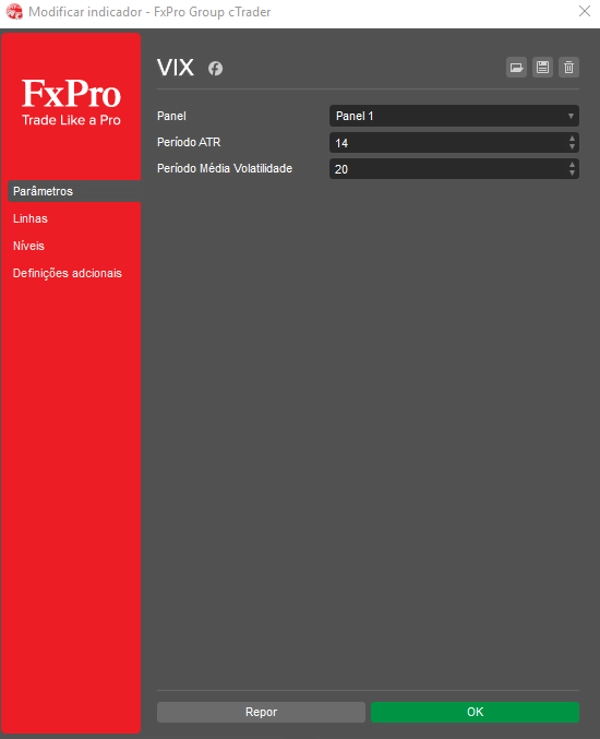
最大の洞察を得るためにセットアップをカスタマイズ
希望する 低VIXレベル と 高VIXレベル の閾値を設定して、インジケーターを簡単にトレーディング戦略に合わせて微調整できます。さらに、VIXスケールファクター を調整して、下部パネルのVIXラインの高さと視覚化を正確に制御します。
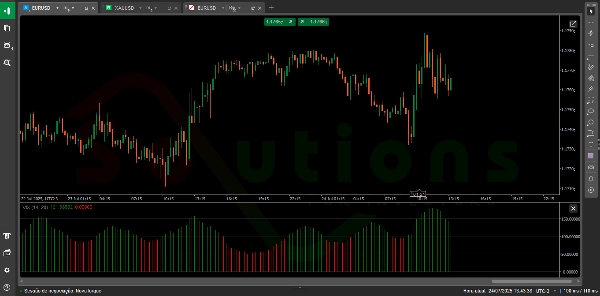
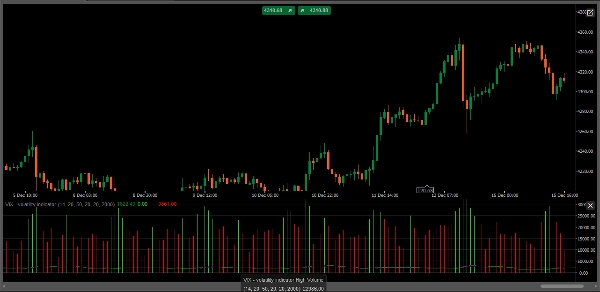
ブレイクアウト&コンソリデーションシグナルの読み方
- ブレイクアウトアラート(高ボラティリティ): VIXラインが 高VIXレベル を強く上抜け、かつ AND 高い出来高(高出来高 ヒストグラムで示される)を伴う場合、これは極端な恐怖/強欲を示し、高確率の市場ブレイクアウトを示唆します。
- コンソリデーションシグナル(低ボラティリティ): VIXラインが 低VIXレベル を下回ると、市場の落ち着き、タイトなコンソリデーション、または潜在的な平均回帰の期間を示すことが多く、次の動きの準備やリスクの縮小に最適です。
- 出来高の洞察: インジケーターは背景に高出来高(緑)と低出来高(赤)のヒストグラムをプロットし、現在の価格動向の流動性と確信度を即座に把握できます。
概要
AIによる概要
The VIX - Volatility Indicator is a proprietary tool designed for the cTrader platform (version 5.5.13 and above) that measures market volatility using an Average True Range (ATR)-based approach. It combines a scaled VIX line with tick volume data to provide dual confirmation of market conditions, helping traders identify potential breakouts and consolidation phases.
Key features include:
- ATR-based VIX calculation for responsive volatility measurement normalized to detect extreme market conditions.
- Volume analysis with high (green) and low (red) volume histograms to assess liquidity and conviction behind price movements.
- Customizable parameters allowing users to set Low VIX Level and High VIX Level thresholds, as well as adjust the VIX Scale Factor for optimal visualization.
Usage signals:
- A breakout alert occurs when the VIX line surpasses the High VIX Level accompanied by high volume, indicating potential market breakouts driven by extreme fear or greed.
- A consolidation signal is identified when the VIX falls below the Low VIX Level, suggesting periods of low volatility, market calm, or potential mean reversion.
This indicator supports analysis across various markets including Forex, indices, commodities, stocks, and cryptocurrencies.
インジケーターのプロフィール
カスタマーレビュー
4.5
レビュー: 2
5 | 50 % | |
4 | 50 % | |
3 | 0 % | |
2 | 0 % | |
1 | 0 % |
カスタマーレビュー
March 6, 2025
ngl, breaks are easier to judge and that is enough to keep testing it. It is not the whole trading plan.
February 28, 2025
reads better when the chart already supports the idea. Spread and slippage need a line in the notes.
ディスカッション
よくあるご質問
BTCUSD
Forex
Signal
Breakout
Indices
EURUSD
Commodities
GBPUSD
NZDUSD
Prop
Crypto
Stocks
XAUUSD
NAS100
USDJPY
cTrader Storeで入手可能な取引ボット、インジケーター、プラグインなどの商品は、第三者の開発者が提供するものであり、情報と技術の取得のみを目的としてご利用いただけます。cTrader Storeはブローカーではなく、投資助言や個人的な推奨を行うことも、将来のパフォーマンスを保証することもありません。
この作成者の他の商品


これも好きかも


価格
登録日 05/02/2025
30
販売