
Penerangan
SR COMMANDER — Edisi Pelbagai Rangka Masa
Lihat di mana wang besar menarik garis. Berdagang pada rangka masa anda. Fikirkan pada rangka masa mereka.
Kebanyakan alat sokongan dan rintangan terikat pada rangka masa carta anda. Jika anda scalping pada M1, tahap S/R anda datang dari lilin M1 — kecil, bising, dan mudah dipalsukan. SR Commander MTF memecahkan rantai itu.
Tetapkan carta anda ke M1. Tetapkan rangka masa SR anda ke H1. Kini anda scalping dengan ketepatan carta satu minit, tetapi tahap sokongan dan rintangan anda diambil dari lilin setiap jam di mana institusi, algoritma, dan pedagang profesional sebenarnya membuat keputusan mereka. Itulah kelebihannya.
BAGAIMANA ENJIN PELBAGAI RANGKA MASA BERFUNGSI
Penunjuk menjalankan dua aliran data bebas secara serentak.
Rangka masa carta anda mengawal apa yang anda lihat — lilin anda, kemasukan anda, anak panah anda, masa anda. Rangka masa SR anda mengawal dari mana tahap itu datang. Kedua-dua aliran ini dipetakan antara satu sama lain secara masa nyata, bar demi bar. Apabila lilin carta baru ditutup, SR Commander mencari lilin rangka masa SR yang betul untuk saat itu dan mengira semula tahap dari struktur rangka masa yang lebih tinggi itu.
Ini bermakna garis sokongan hijau anda dan garis rintangan merah sentiasa mencerminkan struktur berwajaran volatiliti rangka masa SR yang anda pilih — bukan bunyi carta yang anda tonton.
SAINS DI SEBALIK TAHAP-TAHAP
SR Commander tidak hanya melukis garis pada puncak dan dasar ayunan. Ia menggunakan model volatiliti Yang-Zhang — kelas penganggar volatiliti yang sama digunakan dalam penyelidikan kuantitatif profesional — untuk mengira berat statistik sebenar setiap lilin. Setiap tahap diperoleh daripada struktur harga yang dinormalisasi, mengambil kira jurang malam, pergerakan buka-ke-tutup, dan julat intrabar. Hasilnya adalah tahap yang membawa makna matematik sebenar, bukan hanya keutamaan visual.
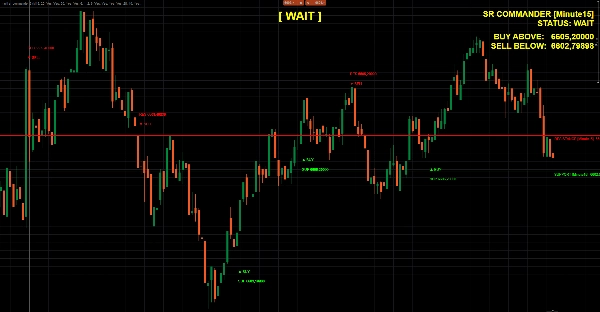
APA YANG ANDA LIHAT DI CARTA
- 🟢 Garis sokongan hijau — lantai yang paling hampir dan signifikan secara statistik di bawah harga semasa, diambil dari rangka masa SR yang anda pilih
- 🔴 Garis rintangan merah — siling yang paling hampir dan signifikan secara statistik di atas harga semasa, diambil dari rangka masa SR yang anda pilih
- ⬆️ Isyarat BELI — aktif apabila harga memantul dari sokongan dengan penutupan bullish yang disahkan pada lilin rangka masa SR
- ⬇️ Isyarat JUAL — aktif apabila harga menolak rintangan dengan penutupan bearish yang disahkan pada lilin rangka masa SR
- 📊 Papan pemuka langsung — menunjukkan rangka masa SR aktif, status semasa, dan harga pencetus pecahan tepat
- 🔵 Label status besar — BELI / JUAL / TUNGGU, dikemas kini setiap bar di tengah atas carta anda
- 🕓 Lapisan sejarah — pantulan, penolakan, pecahan dan keruntuhan ditandakan pada carta untuk pengesahan visual segera
KOMBINASI RANGKA MASA YANG BERFUNGSI
Carta TFSR Rangka MasaKegunaan
M1
M5 atau M15
Scalping pantas dengan struktur jangka pendek
M5
H1
Perdagangan intrahari dengan tahap setiap jam
M15
H4
Kemasukan ayunan dengan struktur 4 jam
H1
D1
Perdagangan posisi berdasarkan S/R harian
Mana-mana
Carta
Mod klasik — tingkah laku TF tunggal asal
CIRI-CIRI
- Enjin pelbagai rangka masa penuh — mana-mana rangka masa SR pada mana-mana rangka masa carta
- Pengiraan tahap dinormalisasi volatiliti Yang-Zhang
- Penyertaan lilin terbesar — sentiasa menangkap lilin struktur dominan bagi tempoh tinjauan
- Logik isyarat pantulan dan penolakan dengan toleransi dan penampan yang boleh dikonfigurasikan
- Pengesanan pecahan dan keruntuhan dengan penampan boleh laras
- Lapisan isyarat sejarah untuk pengesahan segera berasaskan carta
- Papan pemuka dan label status besar dengan saiz dan warna fon yang boleh disesuaikan sepenuhnya
- Tiada cat semula — semua isyarat berdasarkan lilin yang ditutup apabila mod pengesahan aktif
SIAPA YANG SESUAI?
Pedagang yang memahami bahawa kemasukan terbaik berada pada rangka masa lebih rendah, tetapi tahap terbaik berada pada yang lebih tinggi. Jika anda pernah melukis tahap H4 secara manual semasa berdagang M5 — SR Commander mengautomasikan keseluruhan proses itu, mengekalkannya berasaskan matematik, dan meletakkan isyarat terus pada carta anda sebaik harga bertindak balas.
Struktur rangka masa lebih tinggi. Ketepatan rangka masa lebih rendah. Satu penunjuk.
Ringkasan
The indicator calculates S/R levels using the Yang-Zhang volatility model, which accounts for overnight gaps, open-to-close movement, and intrabar range to produce statistically significant levels rather than simple swing highs and lows. On the chart, it shows a green support line and a red resistance line representing the nearest significant levels below and above the current price from the chosen S/R timeframe.
Additional features include buy and sell signals triggered by price reactions to these levels confirmed on the S/R timeframe, a live dashboard displaying current status and breakout prices, a large status label indicating BUY, SELL, or WAIT, and historical overlays marking past bounces, rejections, and breakouts. The indicator supports various timeframe combinations suitable for scalping, intraday, swing, and position trading across markets including forex, indices, commodities, stocks, and crypto.
Ulasan pelanggan
5 | 50 % | |
4 | 50 % | |
3 | 0 % | |
2 | 0 % | |
1 | 0 % |


