
WhaleLiquidityProfile
インジケーター
374 ダウンロード数
バージョン 1.0、May 2026
Windows、Mac
5.0
レビュー: 1
説明
ホエール流動性&吸収プロファイル
機関投資家の資金を追跡し、注文フローを分析し、ボリューム精度で反転ゾーンを特定する
この ホエール流動性&吸収プロファイル は従来のボリュームプロファイルとは異なります。これはマーケットマイクロストラクチャー分析スイートで、すべての取引を分解して、どこでボリュームが取引されたかだけでなく、誰が(機関投資家対個人投資家)取引したか、そして どのように価格がそのレベルで反応したか(攻撃性対吸収)を示します。
最適化されたレンダリングエンジンを搭載しており、すべてのデータを現在の価格の右側に投影し、チャートを完全にクリーンかつ遅延なしに保ちます。
主な特徴
- 強度フィルター(ホエールのみ): パーセンタイルアルゴリズム(例:上位97%)を使用して、機関投資家の「強い」ボリュームと個人投資家の「弱い」ボリュームを分離します。「強いのみ」モードを切り替えて、スマートマネーのフットプリントのみを追跡できます。
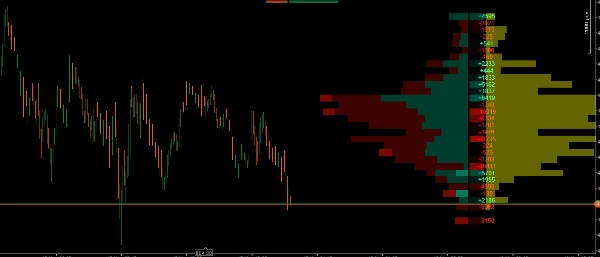
- 積み重ねボリュームプロファイル: 価格レベルごとの強気および弱気のボリューム分布を視覚的に表示し、コントロールポイント(POC)および高/低ボリュームノード(HVN/LVN)を簡単に特定できます。
- 自動バリューエリア検出: 最も多くのボリュームが取引された価格レベル(デフォルト70%)をハイライトし、外側のゾーンを薄くして、市場のコンテキストを一目で読みやすくします。
- デルタプロファイル(ヒートマップ): 各価格レベルでの市場買いと市場売りの正確な差を計算します。数値と視覚的なヒートマップを含み、誰が積極的にコントロールしているかを素早く特定できます。
- 吸収プロファイル(黄色ゾーン): 特にローソク足のヒゲ内に閉じ込められたボリュームを測定します。これにより、スマートマネーが閉じ込められた個人投資家から流動性を受動的に吸収している場所をグラフィカルに確認できます。
- 最適化されたパフォーマンス: 重いボリューム計算は最新のローソク足のみに処理され、cTraderプラットフォームが低い時間足でもスムーズかつ効率的に動作することを保証します。
このインジケーターをトレードでどう使う?
このインジケーターはトレードのための3層の確認を提供します。効果的に組み合わせる方法は以下の通りです:
1. ボリュームプロファイル&バリューエリアでコンテキストを定義する
- ボリュームプロファイルを使用して、価格受容が最も高い場所(バリューエリアとPOC)を特定します。
- 戦略: バリューエリアの下部(サポート)で買いの機会を探し、バリューエリアの上部(レジスタンス)で売りの機会を探します。
2. デルタプロファイルで攻撃性を評価する
- 価格が重要なレベル(例:サポートゾーン)に達したとき、デルタ列を見ます。
- 戦略: サポートで買いを狙う場合、そのレベルで強くプラス(緑色)のデルタが見られれば、買い手が積極的に介入していることを示します。デルタが依然として大幅にマイナスの場合、売り手が支配しています。
3. 吸収プロファイルで完璧なトリガーを見つける(インジケーターの核心)
- ここがこのツールの真骨頂です。市場は急落しているように見える(強いマイナスデルタ)が、価格は下落を止めることがあります。なぜなら、「ホエール」がリミット注文を使って 吸収 しているからです。
- 戦略(反転トレード): 価格が重要なレベルに下落し、デルタがマイナス(閉じ込められた個人売り手)であるが、突然 吸収プロファイルに大きな黄色バーが現れた場合、それは機関投資家がそのヒゲ内のすべての流動性を吸収したことを意味します。これが逆方向にエントリーする最適なトリガーです!
4. 「強度フィルター」を使ってノイズを切り抜ける
- 市場がレンジ相場で方向性が不明瞭な場合は、「強いのみ」オプションをオンにします。これにより、無関係な個人投資家のノイズが隠され、大口資金がどこでポジションを蓄積または分配しているかが正確に表示されます。
概要
AIによる概要
Whale Liquidity & Absorption Profile is a market microstructure indicator designed for detailed volume and order flow analysis. It distinguishes institutional ("whale") volume from retail activity using a percentile-based Strength Filter, enabling users to focus on smart money footprints. The indicator visually presents a stacked volume profile that separates bullish and bearish volume by price level, highlighting key areas such as the Point of Control (POC) and High/Low Volume Nodes (HVN/LVN). It automatically detects the Value Area, where the majority of volume is concentrated, to provide clear market context.
A Delta Profile heatmap calculates the net difference between market buys and sells at each price level, showing buyer or seller aggression. The Absorption Profile identifies volume trapped in candlestick wicks, revealing where institutional traders absorb liquidity from retail participants. The indicator’s optimized engine processes heavy volumetric calculations only on the latest candle, ensuring smooth performance on the cTrader platform.
Traders can use this tool to define market context, evaluate buying or selling aggression, and pinpoint reversal triggers based on absorption patterns. The "Strong Only" mode filters out retail noise during consolidation phases, focusing on institutional accumulation or distribution zones. This indicator supports volume and DOM data visualization to enhance decision-making around key support and resistance levels.
インジケーターのプロフィール
インジケーターのカテゴリー
取引高
出力の種類
ビジュアル表示
データ要件
取引高
DoM
カスタマーレビュー
5.0
レビュー: 1
5 | 100 % | |
4 | 0 % | |
3 | 0 % | |
2 | 0 % | |
1 | 0 % |
カスタマーレビュー
May 21, 2026
Thanks for this sir, the delta and volume are depicted cleanly and accurately on this indicator. With the addition of absortion and filter settings for volume, it beats most in its class.
ディスカッション
よくあるご質問
Key Levels
Volume
Support & Resistance
cTrader Storeで入手可能な取引ボット、インジケーター、プラグインなどの商品は、第三者の開発者が提供するものであり、情報と技術の取得のみを目的としてご利用いただけます。cTrader Storeはブローカーではなく、投資助言や個人的な推奨を行うことも、将来のパフォーマンスを保証することもありません。


これも好きかも


![「[Stellar Strategies] Linear Regression Candles 1.1」ロゴ](https://cdn.ctrader.com/image/webp/8b9cff9f-2431-46d2-b0ec-c7f55f4a4a6d_27918)


価格
25
販売
390
無料インストール