
説明
ビッグキャンドルディテクター
(Avydel Talbo – The5%ers & OFPのプロップファームトレーダーによる)
cTraderで利用可能になりました!
元々MT5向けに開発されたAvydel TalboによるATRビッグキャンドルディテクターは、トレーダーが主要な価格アクションゾーンと重要なキャンドルパターンを効率的かつ正確に識別するのを支援する堅牢なツールです。
概要
ATRビッグキャンドルディテクターは、ユーザー定義の期間内で最も大きく、最も重要なローソク足をチャート上でスキャンします。平均真の範囲(ATR)をボラティリティフィルターとして使用し、これらの「ビッグキャンドル」を持続的な色分けされた長方形で強調表示します。各ゾーンにはキャンドルのパターンタイプと経過日数がラベル付けされており、あらゆるレベルのトレーダーに明確な視覚的コンテキストを提供します。
主な特徴
- ATRベースのフィルタリング:
カスタマイズ可能なATR閾値を超えるキャンドルのみを検出し、本当に重要な動きに焦点を当てます。 - 複数のパターン検出:
-
- 標準モード:ATR基準を満たすすべてのキャンドルを検出します。
- スペシャルモード:アウトサイドバー、エンガルフィングキャンドル、ドージ、マルボウズ、ハンマー、シューティングスター、ピンバー、スピニングトップなどのクラシックな価格アクションパターンをフィルタリングします(自動ラベル付け)。
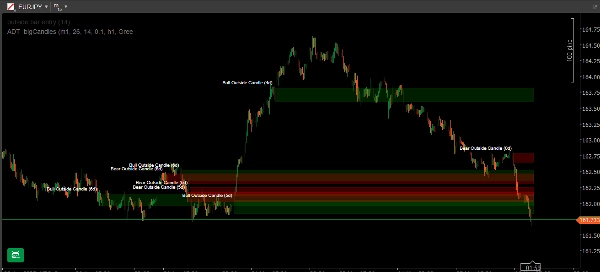
- 持続的な長方形:
各ビッグキャンドルを色分けされた長方形(強気または弱気)でマークし、チャート上に残して参照できるようにします。供給/需要やサポート/レジスタンスゾーンのマッピングに最適です。 - カスタマイズ可能な設定:
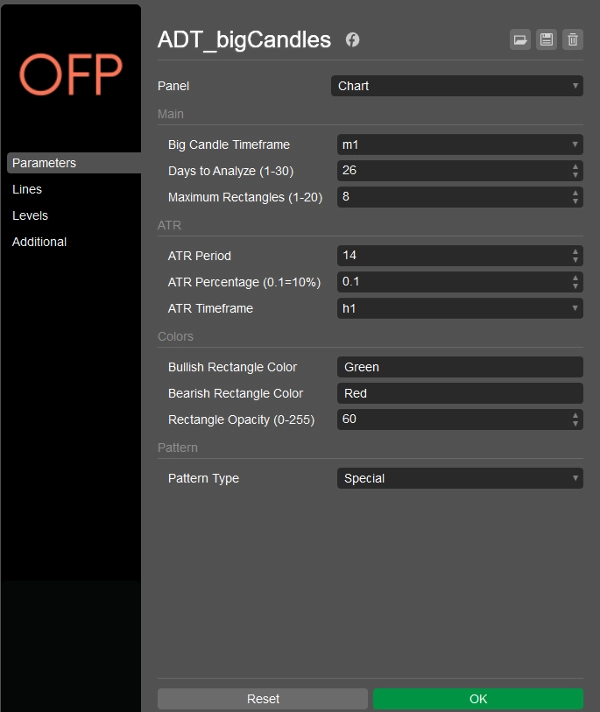
タイムフレーム、スキャン日数、ATR期間、長方形の外観などを調整可能です。 - 重複管理:
同じタイプの長方形の重なりを防ぎ、チャートをすっきりと保ちます。 - パターンラベリング:
各ゾーンに方向、パターンタイプ、発生からの日数がラベル付けされます。
仕組み
- 選択したタイムフレームで最近のキャンドル(最大30日前まで)をスキャンします。
- ATRを計算して動的なレンジ閾値を設定します。
- レンジによって最大のキャンドルを検出し、ランク付けします。
- 迅速な分析のために長方形を描画し、ラベル付けします。
対象ユーザー
- 機関投資家の動きをマッピングするプロップファームおよび個人トレーダー
- 価格アクションおよびテクニカル分析のトレーダー
- 高インパクトのキャンドルとゾーンの識別を自動化したいすべての人
著者について:
The5%ersおよびOFPのプロップファームトレーダーであり、価格アクションとゾーントレーディングに豊富な経験を持つプロフェッショナルです。このインジケーターは実際の取引ニーズに基づいて開発され、ライブ取引環境で日々使用されています。
ゾーン検出を自動化し、価格アクション分析を強化したいトレーダーに最適です。
概要
AIによる概要
The ADT_bigCandles indicator, developed by professional prop firm trader Avydel Talbo, is designed for cTrader to identify significant candlestick patterns and major price action zones. It scans charts over a user-defined period (up to 30 days) and uses the Average True Range (ATR) to filter and detect only the largest, most volatile candles. These "big candles" are highlighted with persistent, color-coded rectangles indicating bullish or bearish moves, aiding in mapping supply/demand and support/resistance zones.
Key features include two detection modes: Standard Mode, which finds all candles exceeding the ATR threshold, and Special Mode, which filters classic price action patterns such as Outside Bars, Engulfing Candles, Doji, Marubozu, Hammer, Shooting Star, Pin Bars, and Spinning Top, with automatic labeling. The indicator prevents overlapping rectangles of the same type for chart clarity and allows customization of timeframe, ATR period, scan duration, and rectangle appearance. Each highlighted zone is labeled with candle direction, pattern type, and age.
This tool is suitable for prop firm and retail traders focused on price action and technical analysis, particularly those automating the identification of high-impact candles and zones for enhanced trading decisions.
インジケーターのプロフィール
カスタマーレビュー
5.0
レビュー: 2
5 | 100 % | |
4 | 0 % | |
3 | 0 % | |
2 | 0 % | |
1 | 0 % |
カスタマーレビュー
May 10, 2025
Ngl, loss rules are easier to respect and that is enough to keep testing it. 30 days gives the idea room.
ディスカッション
よくあるご質問
Prop
ATR
cTrader Storeで入手可能な取引ボット、インジケーター、プラグインなどの商品は、第三者の開発者が提供するものであり、情報と技術の取得のみを目的としてご利用いただけます。cTrader Storeはブローカーではなく、投資助言や個人的な推奨を行うことも、将来のパフォーマンスを保証することもありません。


価格
登録日 06/05/2025
2
販売