
Mô tả
Khối Phá Vỡ CHoCH
https://chartshots.spotware.com/c/69960085a796e
Chỉ báo này được thiết kế cho các nhà giao dịch sử dụng Price Action và Khái niệm Tiền Thông Minh (SMC) làm phương pháp. Khuyến nghị sử dụng:
- 🔍 Xác định CHoCH là tín hiệu đầu tiên của khả năng đảo chiều cấu trúc.
- 👀 Quan sát vùng quan tâm được tạo ra: đây là khu vực mà giá thường quay lại trước khi tiếp tục theo hướng mới.
- ⏳ Chờ giá quay lại vùng và, trong đó, tìm sự đồng thuận với các mức Fibonacci (đặc biệt là 0.382, 0.5, 0.618 và 0.786).
- ✅ Xác nhận với nến bao phủ (nếu ở chế độ StructureBased) bên trong vùng để vào lệnh chính xác hơn.
- ❌ Giao dịch sẽ bị vô hiệu hóa nếu giá vi phạm ranh giới đối diện của vùng, vì chỉ báo sẽ hủy vùng đó ngay lúc đó.
https://chartshots.spotware.com/c/699600271b05d
📊 1. Phân tích Cấu trúc Ba Lớp
Chỉ báo phân tích thị trường qua ba cấp độ phân cấp lồng nhau, từ ít đến nhiều ý nghĩa:
- 🔹 Ngắn hạn: Phát hiện các đỉnh và đáy cục bộ gần nhất bằng cách so sánh ba cây nến liên tiếp. Một đáy cục bộ được xác nhận khi cây nến giữa thấp hơn cả cây trước và cây sau. Đỉnh cục bộ thì ngược lại.
- 🔸 Trung hạn: Xây dựng dựa trên các điểm ngắn hạn. Khi các dao động ngắn hạn tạo thành mẫu thấp hơn thấp hoặc cao hơn cao (nghĩa là ba dao động liên tiếp xác nhận một hướng), một điểm trung hạn được thiết lập.
- 🔺 Dài hạn: Xây dựng theo cách tương tự nhưng sử dụng các điểm trung hạn làm cơ sở. Đây là lớp quan trọng nhất và là lớp kích hoạt các sự kiện chính của chỉ báo.
💡 Cấu trúc phân tầng này đảm bảo rằng chỉ những chuyển động có trọng lượng cấu trúc thực sự mới tạo ra tín hiệu, lọc bỏ nhiễu ngắn hạn.
🔄 2. CHoCH — Thay đổi Tính chất
CHoCH là sự kiện trung tâm của chỉ báo. Nó xảy ra khi:
- 🟢 CHoCH tăng giá: Giá đóng cửa trên một đỉnh cấu trúc dài hạn trước đó, trong khi hướng thị trường trước đó là giảm. Điều này cho thấy người bán đã mất quyền kiểm soát và thị trường có thể đảo chiều đi lên.
- 🔴 CHoCH giảm giá: Giá đóng cửa dưới một đáy cấu trúc dài hạn trước đó, trong khi hướng trước đó là tăng. Điều này cho thấy người mua đã mất quyền kiểm soát và thị trường có thể đảo chiều đi xuống.
Khi phát hiện CHoCH, chỉ báo sẽ vẽ:
- ➡️ Một đường ngang tại mức phá vỡ chính xác (với kiểu và độ dày đã cấu hình)
- 🏷️ Nhãn "CHoCH" ở trên đường đó
- 🟥🟩 Một vùng quan tâm bán trong suốt
🗺️ 3. Vùng Quan Tâm
Ngay sau khi CHoCH xảy ra, chỉ báo tự động xác định vùng giá quan trọng:
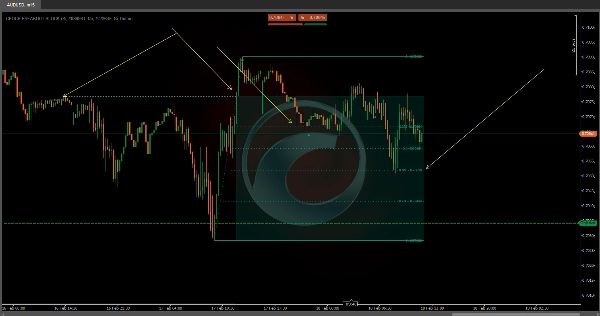
- 🟢 Trong CHoCH tăng giá: Vùng kéo dài từ mức phá vỡ (CHoCH) xuống điểm thấp nhất tìm thấy giữa dao động cấu trúc và thời điểm phá vỡ. Vùng này đại diện cho khu vực giá có thể quay lại để tìm thanh khoản trước khi tiếp tục đi lên.
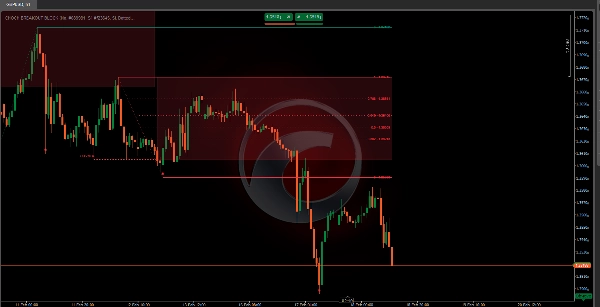
- 🔴 Trong CHoCH giảm giá: Vùng kéo dài từ điểm cao nhất tìm thấy giữa dao động và phá vỡ xuống mức CHoCH. Nó đại diện cho khu vực giá có thể quay lại để tìm thanh khoản trước khi tiếp tục đi xuống.
Vùng tự động mở rộng từng cây nến miễn là giá tôn trọng các ranh giới của nó. Ngay khi giá vi phạm ranh giới đối diện, vùng sẽ ngừng mở rộng — báo hiệu nó đã được kiểm tra hoặc bị vô hiệu hóa.
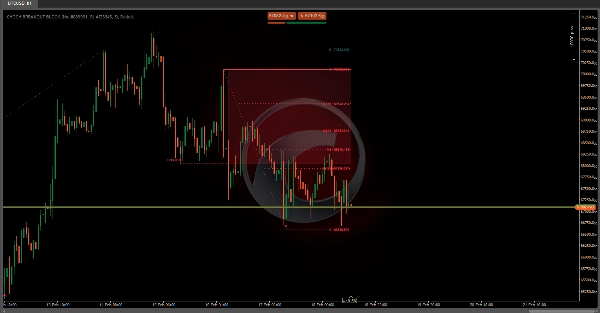
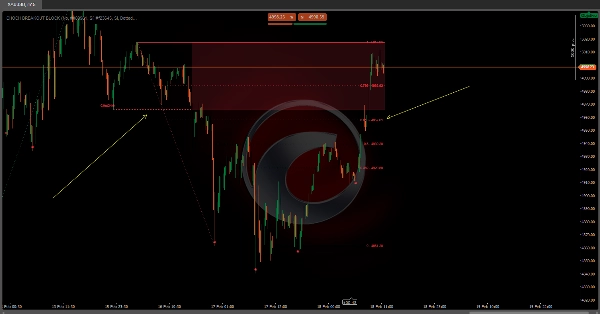
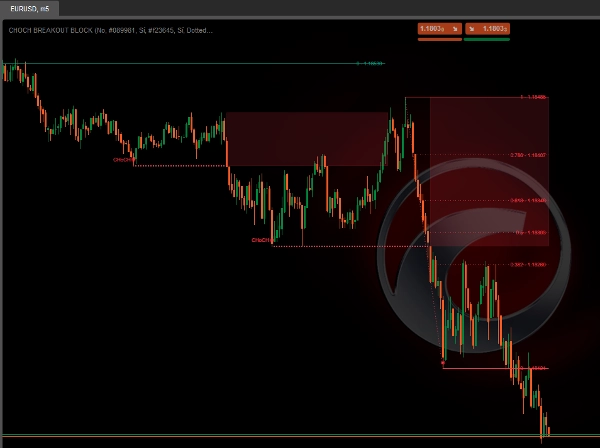
👁️ Như thấy trong hình biểu đồ, các vùng đỏ bán trong suốt đại diện cho các khu vực quan tâm giảm giá sau các sự kiện CHoCH được phát hiện.
📐 4. Mức Fibonacci Tự Động
Sau khi phát hiện CHoCH, chỉ báo KHÔNG vẽ Fibonacci ngay lập tức. Fibonacci xuất hiện ở giai đoạn thứ hai, khi thị trường xác nhận hướng mới có trọng lượng cấu trúc thực sự. Điều này xảy ra qua hai bước:
Bước 1 — CHoCH xảy ra: 🏷️ Đường phá vỡ, nhãn và vùng quan tâm được vẽ. Fibonacci chưa hiển thị.
Bước 2 — Thị trường hình thành dao động dài hạn mới theo hướng của CHoCH: 📐 Chỉ lúc đó chỉ báo mới tự động chiếu các mức Fibonacci giữa điểm tham chiếu phá vỡ và dao động mới được xác nhận đó.
📌 Ví dụ: Trong CHoCH tăng giá, Fibonacci sẽ được vẽ từ điểm thấp nhất tìm thấy trong quá trình phá vỡ lên đến đỉnh dài hạn đầu tiên mà thị trường hình thành sau đó. Nếu giá đang tăng nhưng chưa củng cố dao động cấu trúc đó, các mức Fibonacci sẽ chưa hiển thị — điều này là có chủ ý và không phải lỗi.
Khi hoạt động, các mức mở rộng từng cây nến trong khi cấu trúc còn hợp lệ, và tự động tính toán lại nếu xuất hiện phá vỡ cấu trúc mới. Các mức có sẵn là:
Mức
Ý nghĩa Chung
0
Nguồn gốc của chuyển động
Điều chỉnh nhỏ
⭐ Điều chỉnh quan trọng đầu tiên
0.5
⭐ Mức giữa
⭐ Tỷ lệ Vàng
Biến thể Tỷ lệ Vàng
⭐ Điều chỉnh sâu
1
Mở rộng 100%
🕯️ 5. Phát hiện Nến Bao Phủ
Chỉ báo bao gồm phát hiện mẫu nến bao phủ như một tín hiệu đồng thuận bổ sung:
- ▲ Một nến bao phủ tăng xuất hiện khi một cây nến xanh lớn hoàn toàn bao phủ cây nến đỏ nhỏ trước đó.
- ▼ Một nến bao phủ giảm xuất hiện khi một cây nến đỏ lớn hoàn toàn bao phủ cây nến xanh nhỏ trước đó.
Có hai chế độ hiển thị:
- 📋 Tất cả: Hiển thị mọi mẫu nến bao phủ xuất hiện trên biểu đồ.
- 🎯 StructureBased: Chỉ hiển thị các mẫu nến bao phủ xảy ra bên trong vùng quan tâm đang hoạt động, tăng đáng kể tính liên quan của tín hiệu.
Tóm tắt
When a CHoCH occurs, the indicator marks the breakout level with a horizontal line and label, and automatically creates a semi-transparent interest zone where price is likely to return before continuing in the new direction. This zone extends dynamically as long as price respects its boundaries and is invalidated if price breaks the opposite boundary.
The indicator also projects Fibonacci retracement levels automatically after the market confirms the new trend direction by forming a new long-term swing. Supported Fibonacci levels include 0.236, 0.382, 0.5, 0.618, 0.65, 0.786, and 1. Additionally, it detects bullish and bearish engulfing candle patterns as confluence signals, with options to display all patterns or only those occurring within active interest zones for higher precision.
This tool supports multiple markets including BTCUSD, EURUSD, GBPUSD, NZDUSD, XAUUSD, NAS100, and USDJPY.
Đánh giá của khách hàng
5 | 100 % | |
4 | 0 % | |
3 | 0 % | |
2 | 0 % | |
1 | 0 % |


![Logo "[Hamster-Coder] Bollinger Bands"](https://cdn.ctrader.com/image/webp/21d8e5d6-fb11-4bac-b9ee-cd05c2b76804_30327)


