
Beschreibung
Hinweis: Getestet nur auf cTrader Windows.
LT_Ind_Pivot ist ein leistungsstarker, anpassbarer Pivot-Punkt-Indikator für cTrader, der hilft, wichtige Marktlevels und Sitzungsstrukturen über mehrere Zeitrahmen hinweg zu visualisieren.
Er berechnet und zeichnet automatisch Pivot (P), Support (S1–S5), Resistance (R1–R5) und CPR (TC/BC) Levels basierend auf Ihrem gewählten Anker-Zeitrahmen — von H1, H4, H8, H12, D1, W1 bis Month1.
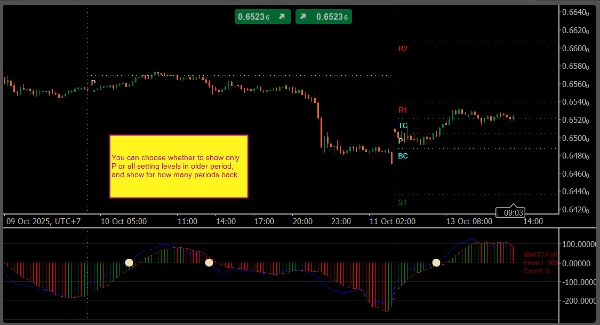
Der Indikator zeichnet außerdem vertikale Trennlinien für jede Ankerperiode, sowohl im Hauptchart als auch in den Indikator-Panels, was das Unterscheiden von Sitzungs- oder Periodengrenzen erleichtert.
Sie können genau definieren, welche Levels angezeigt werden sollen, mit flexibler Notation wie:
P, S1, R1– StandardlevelsPS1,S1S2,R1R2usw. – Zwischenlevels zwischen Pivots und Hauptunterstützungen/-widerständenTC,BC– Central Pivot Range (CPR)
Anzeigeoptionen ermöglichen es Ihnen, festzulegen, wie viele historische Pivots sichtbar bleiben, ob Text-/Preislabels angezeigt werden und wie jedes Level farblich oder stilistisch gestaltet wird.
Hauptmerkmale
- Pivot-Anker: H1, H4, H8, H12, D1, W1, Month1
- Benutzerdefinierte Level-Syntax:
P, Sx, Rx, PS1, S1S2, R1R2, TC, BC - Vertikale Periodentrenner im Chart und in den Indikator-Panels
- Option zur Anzeige von Text, Preisen und alten Pivot-Levels
- Vollständige Farbanpassung und Linienstil-Optionen
- Leichtgewichtig und geeignet für den Live-Handel
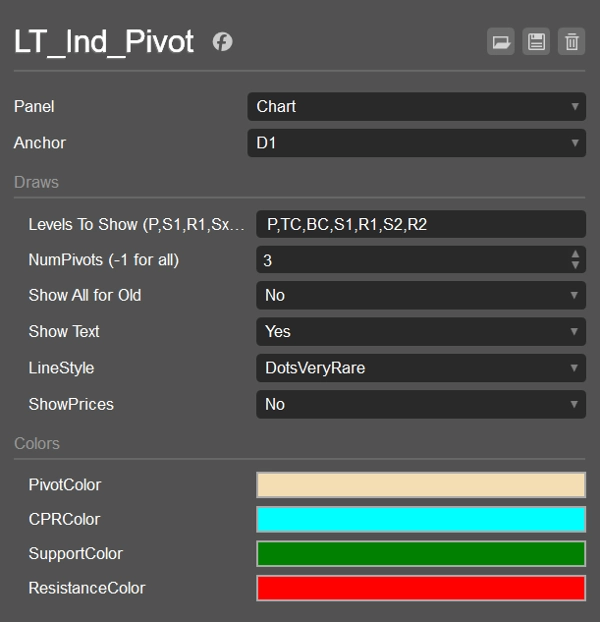
Standardeinstellungen
- Anker: D1
- Angezeigte Levels:
P,S1,R1 - NumPivotsBack: 1
- ShowAllForOldPivots: false
- Text anzeigen: true
- Preise anzeigen: false
- Linienstil: Solid
- Farben: Pivot = Weizen, CPR = Cyan, Support = Grün, Resistance = Rot
Anwendungsfälle
- Markieren Sie intraday- und Swing-Support-/Resistance-Zonen
- Verfolgen Sie CPR und Zwischenlevels für Ausbruchs- oder Mean-Reversion-Setups
- Verwenden Sie Periodentrenner zur Analyse der Sitzungsstruktur von Sitzung zu Sitzung
- Kombinieren Sie mit VWAP- oder Swing-Indikatoren für höhere Übereinstimmung
Zusammenfassung
Kundenbewertungen
5 | 0 % | |
4 | 100 % | |
3 | 0 % | |
2 | 0 % | |
1 | 0 % |


