
설명
고급 맞춤 설정이 가능한 초유연 VWAP 지표:
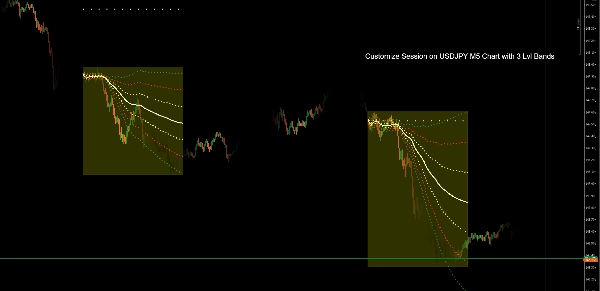
- 스마트 표준 편차 밴드: 정밀한 시장 분석을 위한 최대 3개의 조절 가능한 STD 밴드 지원
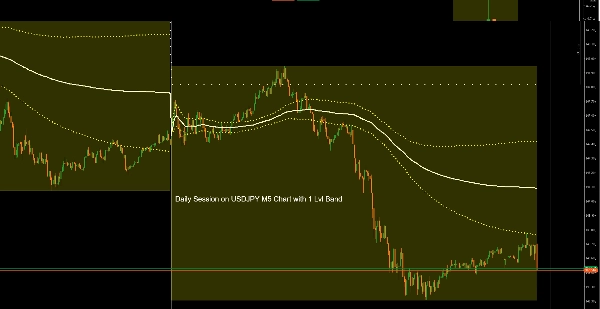
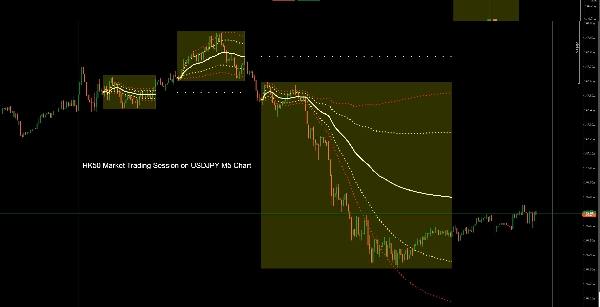
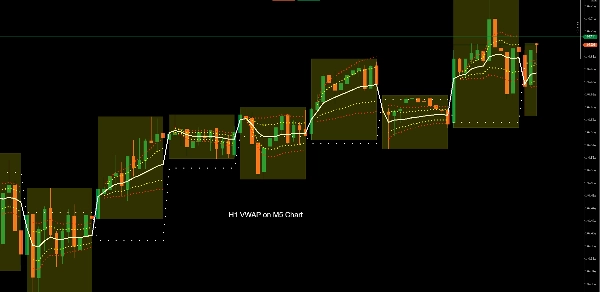
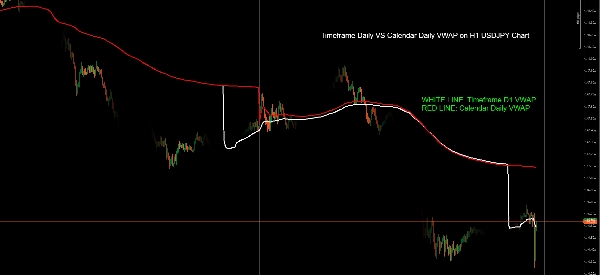
- 다중 세션 적응성: FX/시장 시간/달력일/타임프레임/수동 세션 중 선택 가능
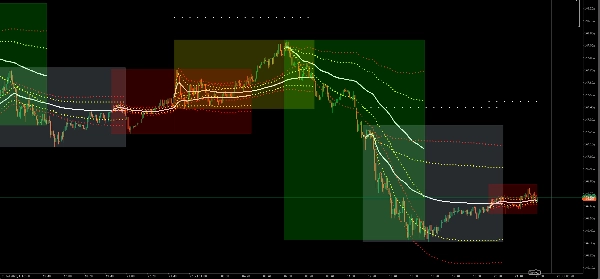
- 향상된 세션 도구: 이전 세션 피벗 및 시각적 세션 박스 마커 포함
- 주말 데이터 제어: 계산에 토요일/일요일 데이터 포함 선택 가능
- 전문가급 맞춤 설정: 개인화된 거래 전략을 위한 완전 구성 가능한 매개변수
요약
지표 프로필
고객 리뷰
5.0
리뷰: 1
5 | 100 % | |
4 | 0 % | |
3 | 0 % | |
2 | 0 % | |
1 | 0 % |
고객 리뷰
August 9, 2025
Awesome! This is exactly the VWAP Bands indicator I was looking for. It includes the VWAP line and three adjustable standard deviation bands. The sessions are fully customizable, so you can display any time range you want. With extras like previous session pivots & session highlighting. Recommended!
상담
자주 묻는 질문(FAQ)
트레이딩 봇, 지표, 플러그인 등 cTrader Store에서 제공되는 상품은 제3자 개발자에 의해 제공되며, 이는 단순히 정보 및 기술적 접근을 목적으로 제공된 것입니다. cTrader Store는 중개인이 아니며, 투자 조언, 개인별 추천 또는 향후 성과에 대한 어떠한 보장도 제공하지 않습니다.
이 작성자의 상품 더 보기

좋아하실 만한 다른 항목


가격
9
판매
16
무료 설치