
Pivot Point Daily Indicator
Wskaźnik
14 zakupy
Wersja 2.0, May 2026
Windows, Mac
4.2
Opinie: 4
Opis
Kluczowe funkcje:
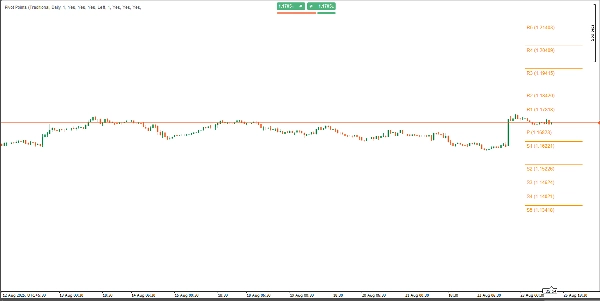
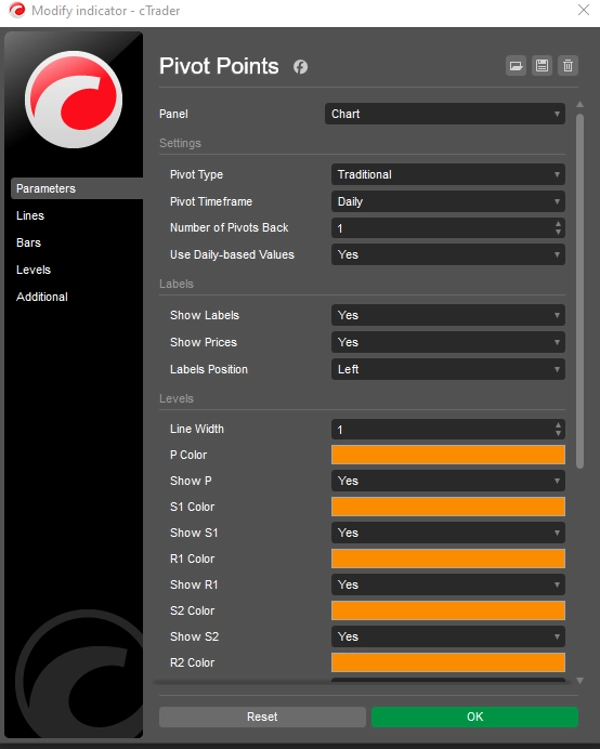
- Wiele stylów Pivot: Płynnie przełączaj się między sześcioma metodami obliczania pivotów: Klasyczną, Fibonacciego, Woodie, Camarilla, DM i Tradycyjną. Każda metoda obsługuje różne poziomy (do R5/S5 dla Tradycyjnej i Camarilla, R3/S3 dla Fibonacciego oraz P/R1/S1 dla DM).
- Elastyczne ramy czasowe: Wybierz spośród szerokiego zakresu ram czasowych pivotów, w tym Auto, Dziennych, Tygodniowych, Miesięcznych, Kwartalnych, Rocznych oraz wieloletnich opcji (Dwuroczne, Trzyletnie, Pięcioletnie, Dziesięcioletnie). Idealne do dopasowania do Twojego horyzontu handlowego.
- Kontrola historycznych pivotów: Ustaw liczbę wyświetlanych zestawów historycznych pivotów (1–200) za pomocą parametru Liczba Pivotów Wstecz, zapewniając przejrzysty wykres przy zachowaniu kluczowych poziomów historycznych.
- Dostosowywalny wygląd: W pełni regulowane kolory, szerokości linii i ustawienia etykiet. Włączaj lub wyłączaj etykiety i wartości cenowe oraz wybieraj pozycje etykiet (lewa lub prawa) z inteligentnymi pionowymi przesunięciami dla czytelności.
- Dane dzienne lub wewnątrzdniowe: Możliwość użycia wartości opartych na danych dziennych lub danych z ram czasowych wykresu, zapewniając elastyczność dla różnych strategii handlowych.
- Optymalna wydajność: Lekki, natywny kod cTrader zapewnia szybkie, aktualizacje w czasie rzeczywistym bez opóźnień, kompatybilny z Forex, indeksami, towarami, kryptowalutami i innymi.
Dlaczego warto wybrać Pivot Points Standard?
- Wszechstronne narzędzie handlowe: Identyfikuj kluczowe poziomy wsparcia/oporu, kierunki trendów i możliwości wybicia na dowolnym rynku lub ramie czasowej.
- Przyjazny interfejs użytkownika: Intuicyjne menu rozwijane dla typu pivotu, ramy czasowej i pozycji etykiety ułatwiają personalizację.
- Analiza historyczna: Wizualizuj do 200 historycznych zestawów pivotów, aby badać przeszłe interakcje cenowe i doskonalić swoją strategię.
- Czyste wykresy: Inteligentne pozycjonowanie etykiet i dostosowywalne długości linii zapobiegają zagraceniu wykresu, poprawiając czytelność.
Jak używać:
- Zastosuj wskaźnik na swoim wykresie cTrader.
- Wybierz preferowany typ Pivot (np. Fibonacciego, Camarilla) oraz ramę czasową Pivot (np. dzienną, miesięczną).
- Dostosuj Liczbę Pivotów Wstecz, aby kontrolować wyświetlane zestawy historyczne.
- Dostosuj kolory, szerokości linii i ustawienia etykiet do swojego stylu.
- Używaj poziomów pivot do identyfikacji wsparcia/oporu, ustawiania stop-loss/take-profit lub handlu wybiciami.
Idealne dla:
- Traderów dziennych: Wykorzystaj dzienne lub tygodniowe pivoty do wejść i wyjść wewnątrzdniowych.
- Traderów swingowych: Używaj miesięcznych lub kwartalnych pivotów, aby uchwycić długoterminowe trendy.
- Skalperów: Łącz z niższymi ramami czasowymi dla szybkich, precyzyjnych transakcji.
- Wszystkie rynki: Działa bezproblemowo na Forex, akcjach, kryptowalutach i towarach.
Zwiększ swoją pewność handlu
Dzięki Pivot Points Standard zyskujesz dostęp do potężnego, wszechstronnego narzędzia, które upraszcza analizę techniczną i zwiększa Twoją zdolność do dostrzegania wysokoprawdopodobnych okazji handlowych. Niezależnie od tego, czy jesteś początkującym, czy doświadczonym traderem, ten wskaźnik dostosowuje się do Twojej strategii, dostarczając jasne, praktyczne poziomy, które podniosą Twój poziom handlu. Wypróbuj Pivot Points Standard już dziś i przejmij kontrolę nad swoim handlem z precyzją i klarownością! Jednorazowa opłata. Dostęp na całe życie. Przyszłe aktualizacje w cenie.
Podsumowanie
Podsumowanie AI
Pivot Point Daily Indicator is a multi-timeframe pivot point tool designed for the cTrader platform. It supports six pivot calculation methods—Classic, Fibonacci, Woodie, Camarilla, DM, and Traditional—each offering various resistance and support levels (up to R5/S5 for some methods). Users can select from a broad range of timeframes including Auto, Daily, Weekly, Monthly, Quarterly, Yearly, and multi-year intervals, allowing alignment with different trading horizons.
The indicator allows displaying up to 200 historical pivot sets to analyze past price interactions while maintaining chart clarity through customizable label positions and line settings. It offers options to use daily-based or intraday data, enhancing flexibility for diverse trading strategies.
Pivot Point Daily Indicator is optimized for real-time performance with native cTrader coding, compatible across Forex, indices, commodities, cryptocurrencies, and other markets. Its interface includes intuitive dropdown menus for pivot type, timeframe, and label customization.
Traders can use this indicator to identify key support and resistance levels, trend directions, and breakout opportunities, aiding in setting stop-loss and take-profit points. It suits various trading styles including day trading, swing trading, and scalping across multiple asset classes.
Profil wskaźnika
Kategoria wskaźnika
Wsparcie i opór
Typ wyjścia
Filtr
Wymagania dotyczące danych
Tylko słupki
Obsługiwane sygnały
Przebicie poziomu
Opinie klientów
4.2
Opinie: 4
5 | 25 % | |
4 | 75 % | |
3 | 0 % | |
2 | 0 % | |
1 | 0 % |
Opinie klientów
May 2, 2026
Bought it, added it, used it for a while, and now it's disappeared, and I cannot get it back!
August 28, 2025
Good helper for review if the trader wants it keeps attention on levels that actually matter. It works best as support, not a final decision maker. The cleanest use is 3 to 5 levels per chart, with 0.5 pullbacks checked before entry. not every zone holds, even if it looks clean.
August 27, 2025
August 27, 2025
Usable tool with purpose for traders who build plans around market levels. It gives value around key price zones, but not every zone holds, even if it looks clean. I would wait for 2 reactions and avoid trades where the target is less than 1.5R. Levels are useful when they reduce noise, not when they crowd the chart.
Dyskusja
Częste pytania
Fibonacci
Prop
Forex
Breakout
Indices
Commodities
Produkty dostępne za pośrednictwem cTrader Store, w tym boty handlowe, wskaźniki i wtyczki, dostarczane są przez deweloperów zewnętrznych i udostępniane wyłącznie w celach informacyjnych oraz w celu zapewnienia dostępu technicznego. cTrader Store nie jest brokerem i nie zapewnia doradztwa inwestycyjnego, nie udziela spersonalizowanych rekomendacji ani nie gwarantuje przyszłych wyników.


Cena
Od 30/05/2025
40
Sprzedaż