
Opis
🚀 System Przełamania Kanału
Ten wyspecjalizowany algorytm został zaprojektowany, aby precyzyjnie potwierdzać punkty wejścia i wyjścia 🎯 poprzez łączenie wielu elementów analizy technicznej, dostarczając wiarygodne sygnały.
🔍 Jak to działa?
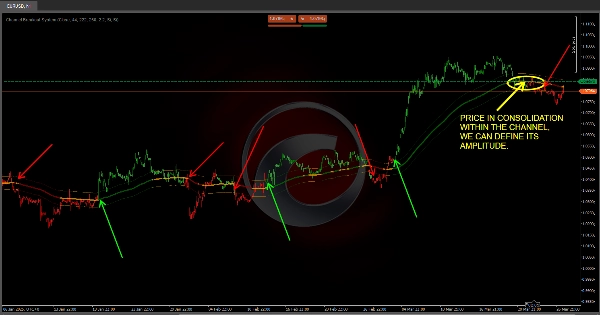
📊 Kanał oparty na zmienności (ATR)
✅ Zmienność rynku jest obliczana za pomocą ATR (Average True Range) 📉.
✅ "Trend MA" jest dostosowywany przez dodanie i odjęcie wartości proporcjonalnej do tej zmienności, tworząc dwie przerywane linie, które działają jako "sufit" i "podłoga" rynku.
✅ Co to dla Ciebie oznacza? Jeśli cena pozostaje w kanale, rynek może się konsolidować lub poruszać w zakresie; jeśli wyraźnie przebija kanał, jest to sygnał silnego ruchu trendu 📈📉.
✅ W pełni konfigurowalny! Dostosuj ustawienia kanału do swojej strategii 📌.
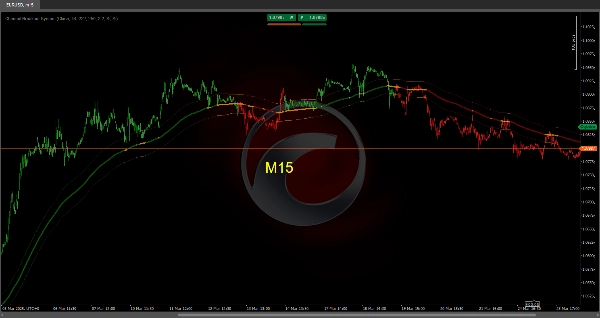
🟢 Wykrywanie trendu za pomocą inteligentnych kolorów
🔹 Wskaźnik porównuje pozycję szybkiej MA z średnią MA, a obie względem Trend MA.
🔹 W zależności od fazy rynku, świece zmieniają kolor:
- 🟢 Zielony → Faza rynku byka.
- 🔴 Czerwony → Faza rynku niedźwiedzia.
- 🟠 Pomarańczowy lub neutralny → Możliwa konsolidacja lub niepewność.
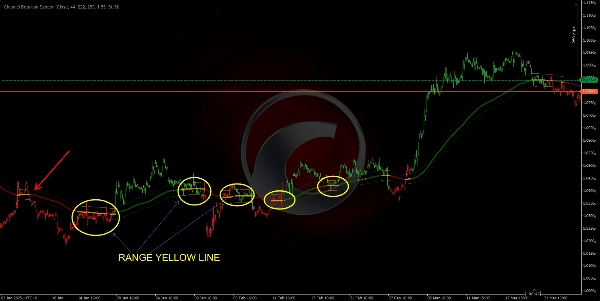
🔹 Jeśli cena i średnie kroczące są "uwięzione" w kanale, sygnalizuje to fazę konsolidacji, pomagając unikać handlu w strefach niepewności.
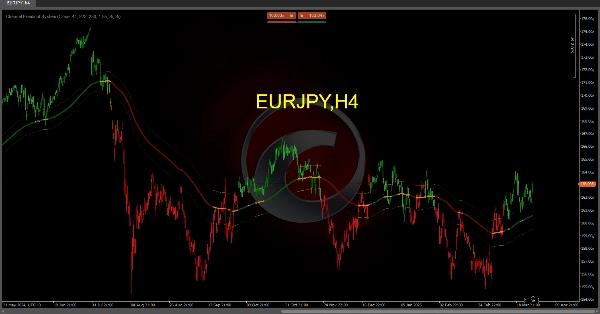
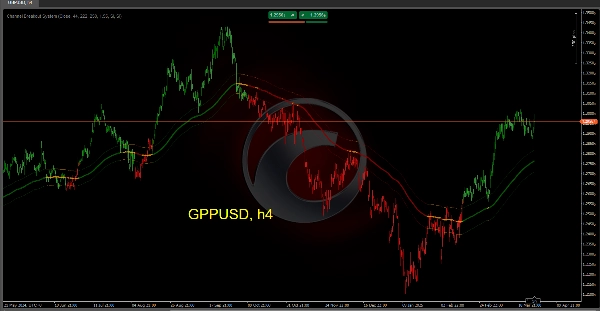
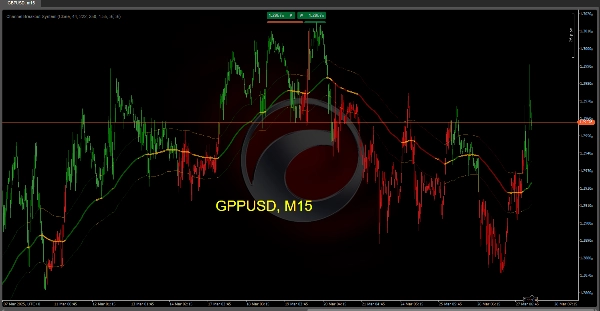
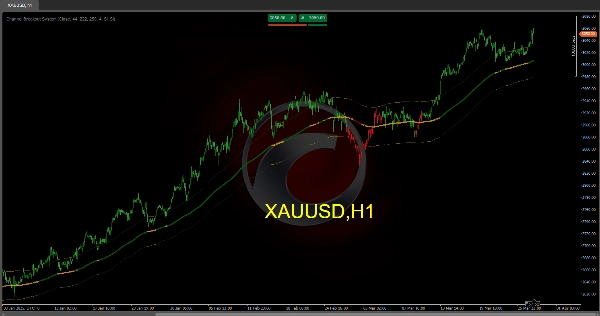
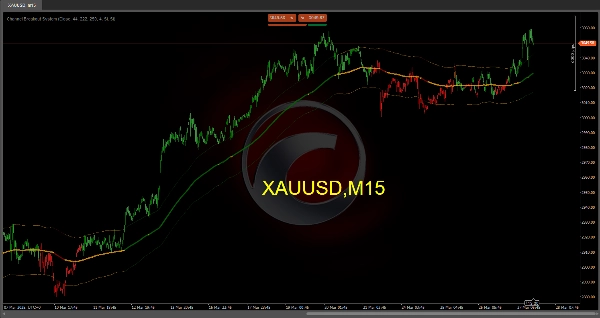
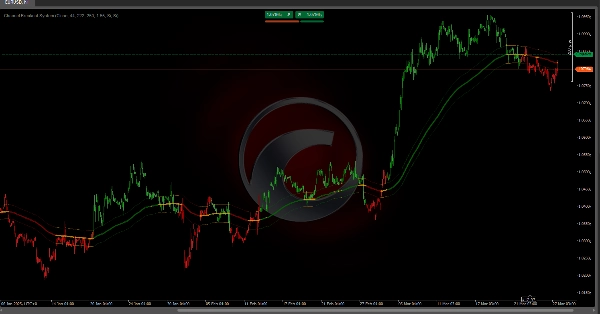
🎯 Jak to wygląda na wykresie
🔵 Główna linia trendu: Zmienia kolor w zależności od kierunku rynku (zielony, czerwony lub pomarańczowy).
📏 Przerywany kanał: Odzwierciedla zakres rynku na podstawie zmienności.
📊 Kolorowe słupki: Umożliwiają łatwą wizualizację aktualnej fazy rynku.
🚀 Dlaczego warto używać tego systemu?
✔ Szybko identyfikuje, czy rynek jest w trendzie czy w zakresie.
✔ Wizualnie podkreśla siłę i kierunek trendu.
✔ Przewiduje potencjalne odwrócenia za pomocą wyraźnych sygnałów przełamania i przecięcia.
✔ Potwierdza punkty wejścia i wyjścia, zmniejszając fałszywe sygnały i poprawiając dokładność transakcji.
🔹 Optymalizuj swój handel i działaj z większą pewnością, korzystając z Systemu Przełamania Kanału 🏆. Przygotuj się na wyłapywanie najlepszych okazji rynkowych! 📈🔥
Wskaźniki ze sklepu Ctrader:
Dynamic Market Structure
Analiza Punktów Zwrotnych
Fibonacci Linear
Regresja Wielookresowa
Multi-Level Candle Bias
Tracker
Auto Support and
Resistance Trend Lines
All Support and
Resistance Levels
Podsumowanie
Opinie klientów
5 | 33 % | |
4 | 67 % | |
3 | 0 % | |
2 | 0 % | |
1 | 0 % |


![Logo „Gaussian Channel [Iridio Capital]”](https://cdn.ctrader.com/image/webp/7c039209-5573-4a54-a072-f9528b503103_41960)


