
Opis
Przedstawiamy zaawansowany wskaźnik QQE (Qualitative Quantitative Estimation), potężne narzędzie łączące dwa wskaźniki QQE dla lepszych analiz handlowych.
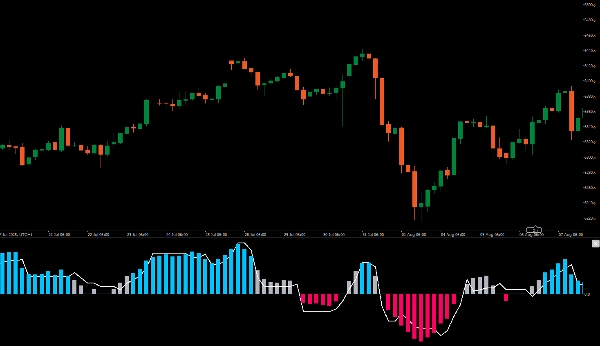
Jeden QQE jest wyświetlany na wykresie jako kolumny, podczas gdy drugi działa w tle z 50-okresową wstęgą Bollingera pełniącą rolę linii zerowej.
To ustawienie pozwala wizualnie ocenić momentum rynku i jasno zidentyfikować potencjalne punkty wejścia. Gdy oba wskaźniki QQE się pokrywają, zobaczysz wyraźne niebieskie lub czerwone słupki, sygnalizujące silne okazje do kupna lub sprzedaży.
Podnieś swoją strategię handlową dzięki wskaźnikowi QQE, aby podejmować bardziej świadome decyzje i zwiększyć dokładność analizy rynku.Przedstawiamy zaawansowany wskaźnik QQE (Qualitative Quantitative Estimation), potężne narzędzie łączące dwa wskaźniki QQE dla lepszych analiz handlowych.
Jeden QQE jest wyświetlany na wykresie jako kolumny, podczas gdy drugi działa w tle z 50-okresową wstęgą Bollingera pełniącą rolę linii zerowej.
To ustawienie pozwala wizualnie ocenić momentum rynku i jasno zidentyfikować potencjalne punkty wejścia. Gdy oba wskaźniki QQE się pokrywają, zobaczysz wyraźne niebieskie lub czerwone słupki, sygnalizujące silne okazje do kupna lub sprzedaży.
Podnieś swoją strategię handlową dzięki wskaźnikowi QQE, aby podejmować bardziej świadome decyzje i zwiększyć dokładność analizy rynku.
Podsumowanie
Opinie klientów
5 | 100 % | |
4 | 0 % | |
3 | 0 % | |
2 | 0 % | |
1 | 0 % |


