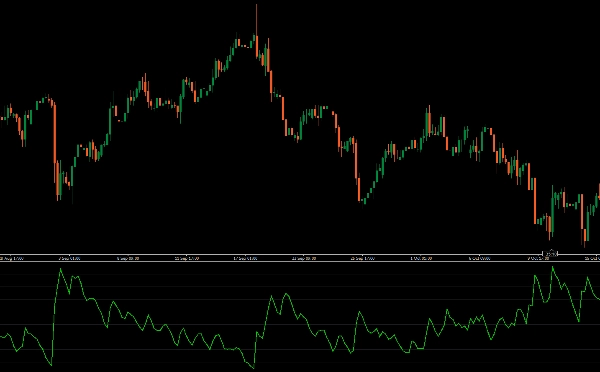
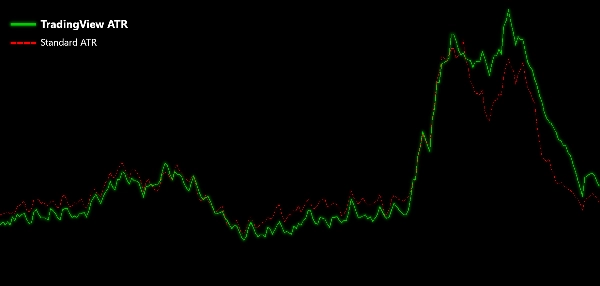
Brokerzy i firmy proptradingowe
Dla firm
00
Days
:
00
Hours
:
00
Minutes
:
00
Seconds
Wskaźnik
NAS100
NZDUSD
XAUUSD
Commodities
Forex
EURUSD
GBPUSD
BTCUSD
Indices
Prop
ATR
Stocks
Crypto
USDJPY
TradingView ATR
07/11/2025
Desktop
Od 25/09/2025
Sprzedaż
13
Przesłany obraz „TradingView ATR”Przesłany obraz „TradingView ATR”

Introducing the TradingView ATR indicator for cTrader, designed to match the precision of TradingView’s Average True Range calculation.

This enhanced ATR uses a Relative Moving Average (RMA) for its calculations, providing a more accurate reflection of market volatility compared to the default ATR in cTrader. By incorporating the RMA, this indicator offers smoother and more responsive volatility readings, helping you make better-informed trading decisions.

Perfect for traders seeking improved accuracy in their technical analysis, this ATR indicator is a powerful tool to elevate your trading strategy.

Upgrade your cTrader toolkit with this ATR indicator for precise and reliable volatility insights.

0.0
Opinie: 0
Opinie klientów
Ten produkt nie ma jeszcze opinii. Wypróbowałeś(-aś) go już? Bądź pierwszy(-a) i powiedz o tym innym!
Więcej od tego autora
Wskaźnik
NAS100
NZDUSD
XAUUSD
+13
Chandelier Exit
Optimize exits with Chandelier Exit! Visualize stop-loss points dynamically for improved trading precision and safety.
Wskaźnik
NAS100
NZDUSD
Breakout
+12
ATR Bands
Enhance trading with ATR Bands! Visualize market volatility using dynamic upper and lower ATR bands for precise decision
Wskaźnik
NAS100
NZDUSD
XAUUSD
+13
MACD Crossover PRO
Customize the MACD! Choose colors, get real-time tick updates, and see crossover points for enhanced trading precision.
Wskaźnik
NAS100
NZDUSD
XAUUSD
+13
MACD Histogram PRO
Enhance MACD Histogram! Visualize bull and bear price changes with vibrant colors for clearer, more insightful trading.
Wskaźnik
NAS100
NZDUSD
XAUUSD
+12
QQE Qualitative Quantity Estimation
Unlock trading precision with QQE! Dual QQE indicators with a Bollinger Bands zero line provide clear buy/sell signals.
Wskaźnik
NAS100
RSI
NZDUSD
+13
Stochastic RSI PRO
Unlock Stochastic RSI PRO in cTrader! Overlay RSI, highlight zones, and identify divergences with customizable settings.
Wskaźnik
NAS100
NZDUSD
XAUUSD
+11
Consolidation Zones
Identify and trade breakouts with Consolidation Zones! Visualize price consolidation areas for trading opportunities.
Wskaźnik
Grid
NAS100
NZDUSD
+13
Standard Deviation Channel
Visualize trends with Standard Deviation Channel! Display median, and add customizable upper/lower deviation channels.
Wskaźnik
NAS100
NZDUSD
XAUUSD
+10
Moving Average PRO
Customize your Moving Average! Choose any timeframe and price source for precision and flexibility in your analysis.
Wskaźnik
NAS100
NZDUSD
XAUUSD
+11
TSI True Strength Index
Enhance trading with TSI! Use the True Strength Index for clear insights into market momentum and trend strength.
Wskaźnik
NAS100
NZDUSD
Breakout
+14
Bollinger Bands Cloud
Visualize Bollinger Bands with a colored cloud for clarity. Enhance your trading precision with this dynamic indicator!
Wskaźnik
NAS100
NZDUSD
Breakout
+13
VWAP Volume Weighted Average Price
Unlock VWAP in cTrader! Choose anchor periods, price sources, and display deviation bands with real-time tick updates.
Możesz także polubić
Najwyżej oceniane
Za darmo
Wskaźnik
RSI
Breakout
Signal
+1
ZScore
Z-Score measures price deviation from its average, helping identify extremes, trends, and trading opportunities ........
Wskaźnik
NAS100
Indices
Prop
+3
session indicator
📈 Trading Sessions Indicator — London, New York & Tokyo Visualize Key Market Sessions + High/Low Levels with Precision
ICT Killzone and Sessions high_low
This indicator is an essential tool for traders seeking to visualize key trading sessions on their charts.
Daily Sessions HighLow Helper
Shows daily and sessions highs / lows and session boxes, everything configurable
Wskaźnik
NAS100
NZDUSD
XAUUSD
+10
[Stellar Strategies] VBO
Next-gen Volume Oscillator using Hyperbolic Tangent math. No repainting. Includes arrows, alerts, and overlay mode 🎯
Wskaźnik
Indices
ADXMultiframeIndicator
Multi-Timeframe ADX Trend Dots & Arrows
Wskaźnik
Grid
RSI
XAUUSD
+12
PFO Price Flow Oscillator
technical analysis tool designed to provide traders with a structured view of market momentum and volatility
Wskaźnik
Grid
NAS100
RSI
+19
Delta-RSI Candle Pro
Delta RSI Candle Pro
Wskaźnik
NAS100
NZDUSD
Breakout
+17
Deviation Indicator by PrimeQuant
True Deviation - Trade extremes and reversions with deviation channels, SMC swings, liquidity levels, and impulse bias.
Wskaźnik
ATR
Stocks
Commodities
+2
LevelMaster SR
LevelMaster S/R: Pinpoint key support & resistance zones with precision. Perfect for traders of all levels Trade smarter
Clarosti
Clarosti a chave para decisões inteligentes no mercado
Wskaźnik
Indices
RSI
StochasticRSI
Stochastic RSI (StochRSI) is a technical indicator used to measure the strength and weakness of the RSI.
Wskaźnik
Breakout
Signal
SMC
Free_ICT Breakers_BOS_MSS_withSourceCode
ICT Breakers (BOS/MSS) - Professional market structure and breakout detection tool.
Wskaźnik
Grid
NAS100
RSI
+19
Smart Volume Delta
Detects smart money activity using advanced tick volume and price divergence analysis.
Wskaźnik
NAS100
NZDUSD
RSI
+11
RSI Channel Trigger
🧠Visually marks momentum zones when the RSI crosses the overbought/oversold thresholds (default 70/30). ✅
Break of Structure
The Break of Structure (BoSCHoCh) Indicator is a smart market structure tool designed to help traders easily spot trend.
Daily Open Pivot Level
This indicator is a valuable tool for traders looking to identify significant opening price level of any asset.