
説明
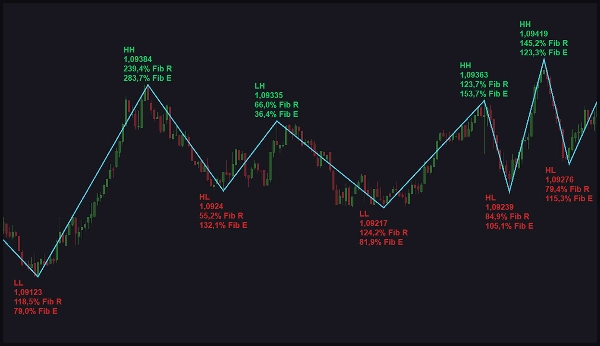
cTrader ZigZag Alertsインジケーターは、より高い高値、より高い安値、より低い安値などをプロットすることで価格のスイングを追跡するのに役立ちます。また、スイングを比較してフィボナッチのリトレースメントとエクスパンションを計算します。ZigZagラインはすべてのシンボル、時間枠、価格帯で一貫しており、信頼できる分析を提供します。
主な特徴:
- 調整可能な感度: 市場状況に応じてインジケーターがスイングを検出する方法をカスタマイズします。
- ラベルオプション: 短縮ラベルまたは完全なラベルから選択して明確な視覚化を実現します。
- フォント&カラーのカスタマイズ: テキストサイズを変更し、強気/弱気の色を定義して読みやすさを向上させます。
- スイングラベル&価格: 対応する価格とともにスイングラベルを表示して洞察を深めます。
- フィボナッチレベル: エントリーおよびエグジットポイントの改善のためにフィボナッチのリトレースメントとエクスパンションレベルを表示します。
- アラート管理: 必要に応じてすべてのアラートを即座に一時停止します。
- カスタムコメント: アラートに表示されるコメントを追加して識別を容易にします。
- 複数のアラートオプション: サウンド、ポップアップ、Telegram、またはメールでアラートを受け取ります。
- スイング特定のアラート: 選択したスイングタイプのアラートを受け取り、設定した時間だけアラートを一時停止します。
- フィボナッチアラート: フィボナッチのリトレースメントとエクスパンションに関するアラートで情報を得続けます。
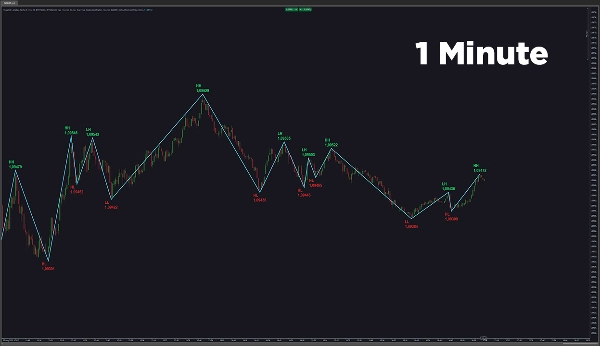
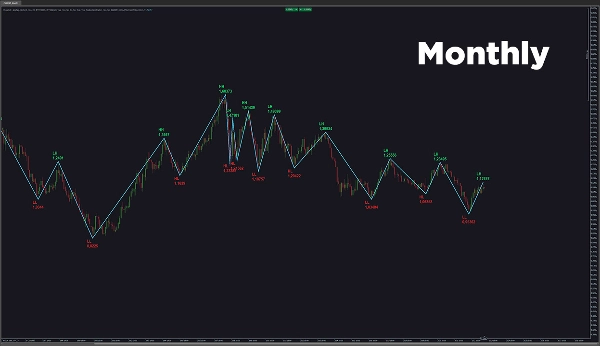
- 一貫したZigZagライン: 他のインジケーターとは異なり、すべての時間枠と価格帯で均一なスイング検出を維持します。
- ユーザーガイド: チャート上のボタンからユーザーガイドにすばやくアクセスできます。
cTrader ZigZag Alertsは正確なスイング検出とアラートのカスタマイズを提供し、トレーダーが自信を持って情報に基づいた意思決定を行うのを支援します。
概要
AIによる概要
VegaXLR - ZigZag Alerts is a cTrader indicator designed for precise price swing analysis. It identifies and plots key swing points such as Higher Highs, Higher Lows, and Lower Lows, maintaining consistent ZigZag lines across all symbols, timeframes, and price ranges. The indicator calculates Fibonacci retracement and expansion levels by comparing swings, aiding in identifying potential entry and exit points.
Key features include adjustable sensitivity for swing detection tailored to market conditions, customizable label formats (abbreviated or full), and font and color settings to distinguish bullish and bearish swings. Swing labels display corresponding prices for enhanced clarity. Alert management options allow users to pause alerts instantly, add custom comments for easy identification, and receive notifications via sound, pop-ups, Telegram, or email. Alerts can be configured for specific swing types and Fibonacci levels, with the ability to pause alerts temporarily.
A user guide is accessible directly from the chart for quick reference. This indicator supports traders in monitoring market swings and Fibonacci levels with customizable alerts to facilitate informed trading decisions.
インジケーターのプロフィール
カスタマーレビュー
4.3
レビュー: 3
5 | 33 % | |
4 | 67 % | |
3 | 0 % | |
2 | 0 % | |
1 | 0 % |
カスタマーレビュー
February 15, 2025
Simple but not useless around swing point analysis. The useful part is reviewing reversals, pullbacks and swing zones, with the numbers checked before scaling. I would test 20 swing signals and ignore setups where the stop is wider than the 1.5R target. The level is useful when it supports the market story.
February 14, 2025
February 14, 2025
Fair pick for discipline if the trader wants it helps identify turning points and cleaner structure. It works best as support, not a final decision maker. Swing points look better after 3 pivots, especially when the 0.5 Fib area agrees with structure. the signal still needs broader context.
ディスカッション
よくあるご質問
Forex
cTrader Storeで入手可能な取引ボット、インジケーター、プラグインなどの商品は、第三者の開発者が提供するものであり、情報と技術の取得のみを目的としてご利用いただけます。cTrader Storeはブローカーではなく、投資助言や個人的な推奨を行うことも、将来のパフォーマンスを保証することもありません。
この作成者の他の商品


価格
231
販売
694
無料インストール