
Descripción
Buscador de señales de velas para cTrader
Convierte las velas japonesas en un lenguaje visual claro.
Candlestick Signal Finder es un indicador avanzado para cTrader que detecta automáticamente los patrones de velas japonesas más populares y los resalta directamente en tu gráfico usando etiquetas y colores claros.
No más escanear vela por vela: el indicador realiza el reconocimiento de patrones por ti y muestra dónde el precio está generando señales potenciales de reversión o indecisión.
Patrones detectados
El indicador identifica automáticamente:
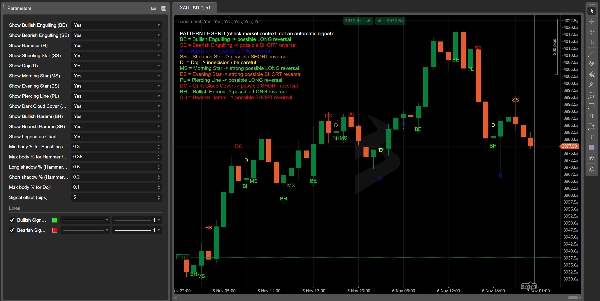
- BE – Engulfing alcista → posible reversión alcista
- SE – Engulfing bajista → posible reversión bajista
- H – Martillo → posible rebote/reversión alcista tras una caída
- SS – Estrella fugaz → posible reversión bajista tras un rally
- D – Doji → indecisión, zona para tener precaución
- MS – Estrella de la mañana → fuerte potencial de reversión alcista
- ES – Estrella de la tarde → fuerte potencial de reversión bajista
- PL – Línea penetrante → posible reversión alcista
- DC – Cubierta de nube oscura → posible reversión bajista
- BH – Harami alcista → posible reversión alcista
- SH – Harami bajista → posible reversión bajista
Cada patrón está marcado en la vela exacta con un código corto (BE, H, SS, etc.) y un color que coincide con la leyenda.
Leyenda codificada por colores en el gráfico
En la esquina superior izquierda del gráfico obtienes una leyenda codificada por colores que coincide con las señales:
- mismo código
- mismo color
- breve explicación de lo que usualmente significa (LARGO / CORTO / precaución)
Esto hace que el indicador sea perfecto para:
- traders que están aprendiendo patrones de velas
- aquellos que quieren un recordatorio visual rápido sin abrir un libro o sitio web
- educadores o creadores de contenido que usan gráficos para enseñar y revisar operaciones
Parámetros totalmente personalizables
Candlestick Signal Finder te da control total sobre la sensibilidad de detección:
- Porcentaje mínimo de cuerpo para velas engulfing y fuertes
- Porcentaje máximo de cuerpo para martillo, estrella fugaz y harami
- Relación de sombra larga/corta para patrones tipo Martillo / Estrella fugaz
- Sensibilidad Doji (qué tan pequeño debe ser el cuerpo en relación con el rango completo)
- Desplazamiento de señal en pips para colocar etiquetas arriba o abajo de las velas
- Interruptores individuales de encendido/apagado para cada patrón
Puedes ajustarlo para señales muy estrictas (pocas pero claras) o una detección más permisiva para backtesting visual y entrenamiento.
Por qué a los traders les gusta
- Ahorra tiempo: no más búsqueda manual de patrones de velas.
- Reduce la subjetividad: las reglas son numéricas y repetibles, no basadas en la interpretación visual.
- Ideal para educación: perfecto para entrenar tu ojo desplazándote por el historial y verificando cómo funcionaron los patrones.
- Multi-temporalidad y multi-símbolo: funciona en índices, FX, criptomonedas, acciones, materias primas – en cualquier lugar donde puedas añadir un indicador en cTrader.
⚠️ Importante: Candlestick Signal Finder no es un sistema de trading completo y no reemplaza una estrategia completa. Los patrones siempre deben usarse junto con análisis de tendencia, contexto de mercado y una gestión adecuada del riesgo.
Resumen
The indicator offers customizable detection sensitivity, allowing users to adjust parameters like minimum and maximum body size percentages, shadow ratios, Doji sensitivity, and label positioning. Individual patterns can be enabled or disabled to tailor the indicator to specific needs.
Candlestick Signal Finder supports multiple timeframes and symbols, including indices, forex, cryptocurrencies, stocks, and commodities. It is intended to assist traders in pattern recognition, reduce subjectivity through numeric rules, and serve as an educational tool for learning candlestick analysis. The indicator does not constitute a complete trading system and should be used alongside other analysis methods and risk management practices.
Valoraciones de clientes
5 | 100 % | |
4 | 0 % | |
3 | 0 % | |
2 | 0 % | |
1 | 0 % |


