
Opis
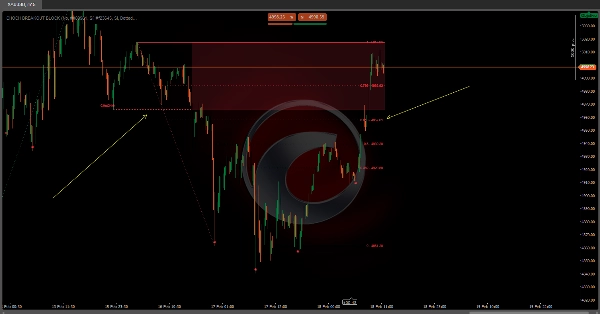
Blok Wybicia CHoCH
https://chartshots.spotware.com/c/69960085a796e
Ten wskaźnik jest przeznaczony dla traderów operujących metodologiami Price Action i Smart Money Concepts (SMC). Zalecane zastosowanie:
- 🔍 Zidentyfikuj CHoCH jako pierwszy sygnał możliwej zmiany strukturalnej.
- 👀 Obserwuj wygenerowaną strefę zainteresowania – jest to obszar, do którego cena zwykle wraca przed kontynuacją w nowym kierunku.
- ⏳ Poczekaj, aż cena wróci do strefy i w jej obrębie szukaj zbieżności z poziomami Fibonacciego (szczególnie 0.382, 0.5, 0.618 i 0.786).
- ✅ Potwierdź za pomocą świecy objęcia (jeśli w trybie StructureBased) wewnątrz strefy dla większej precyzji wejścia.
- ❌ Transakcja jest unieważniona jeśli cena naruszy przeciwną granicę strefy, ponieważ wskaźnik sam anuluje strefę w tym momencie.
https://chartshots.spotware.com/c/699600271b05d
📊 1. Analiza Trójwarstwowej Struktury
Wskaźnik analizuje rynek na trzech zagnieżdżonych poziomach hierarchicznych, od najmniej do najbardziej znaczącego:
- 🔹 Krótkoterminowy: Wykrywa najnowsze lokalne maksima i minima, porównując trzy kolejne świece. Lokalny dołek jest potwierdzony, gdy środkowa świeca jest niższa od poprzedniej i następnej. Lokalny szczyt działa odwrotnie.
- 🔸 Średnioterminowy: Budowany na bazie punktów krótkoterminowych. Gdy krótkoterminowe wahania tworzą wzór niższych dołków lub wyższych szczytów (co oznacza, że trzy kolejne wahania potwierdzają kierunek), ustalany jest punkt średnioterminowy.
- 🔺 Długoterminowy: Budowany dokładnie w ten sam sposób, ale używając punktów średnioterminowych jako bazy. To jest najbardziej znacząca warstwa i ta, która wyzwala główne zdarzenia wskaźnika.
💡 Ta kaskadowa struktura zapewnia, że tylko ruchy o rzeczywistej wadze strukturalnej generują sygnały, filtrując krótkoterminowy szum.
🔄 2. CHoCH — Zmiana Charakteru
CHoCH jest centralnym zdarzeniem wskaźnika. Występuje, gdy:
- 🟢 Byczy CHoCH: Cena zamyka się powyżej poprzedniego długoterminowego szczytu strukturalnego, podczas gdy wcześniejszy kierunek rynku był niedźwiedzi. Wskazuje to, że sprzedający stracili kontrolę i rynek może odwrócić się w górę.
- 🔴 Niedźwiedzi CHoCH: Cena zamyka się poniżej poprzedniego długoterminowego dołka strukturalnego, podczas gdy wcześniejszy kierunek był byczy. Wskazuje to, że kupujący stracili kontrolę i rynek może odwrócić się w dół.
Gdy wykryty zostanie CHoCH, wskaźnik rysuje:
- ➡️ poziomą linię na dokładnym poziomie wybicia (z ustawionym stylem i grubością)
- 🏷️ Etykietę "CHoCH" nad tą linią
- 🟥🟩 półprzezroczystą strefę zainteresowania
🗺️ 3. Strefa Zainteresowania
Bezpośrednio po CHoCH wskaźnik automatycznie wyznacza kluczową strefę cenową:
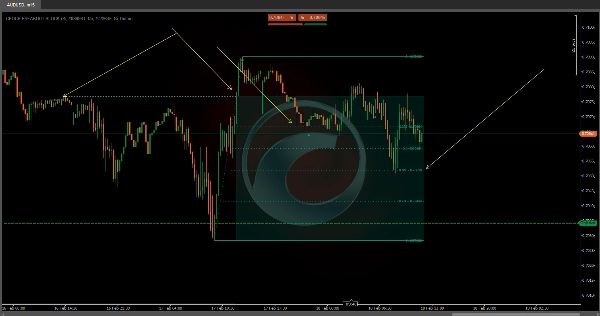
- 🟢 W byczym CHoCH: Strefa rozciąga się od poziomu wybicia (CHoCH) w dół do najniższego punktu znalezionego pomiędzy wahaniem strukturalnym a momentem wybicia. Ta strefa reprezentuje obszar, do którego cena może wrócić, aby szukać płynności przed kontynuacją wzrostu.
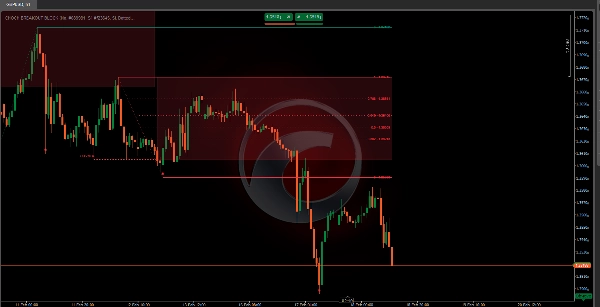
- 🔴 W niedźwiedzim CHoCH: Strefa rozciąga się od najwyższego punktu znalezionego pomiędzy wahaniem a wybiciem w dół do poziomu CHoCH. Reprezentuje obszar, do którego cena może wrócić, aby szukać płynności przed kontynuacją spadku.
Strefa automatycznie rozszerza się z każdą kolejną świecą , dopóki cena respektuje jej granice. W momencie, gdy cena naruszy przeciwną granicę, strefa przestaje się rozszerzać — co oznacza, że została przetestowana lub unieważniona.
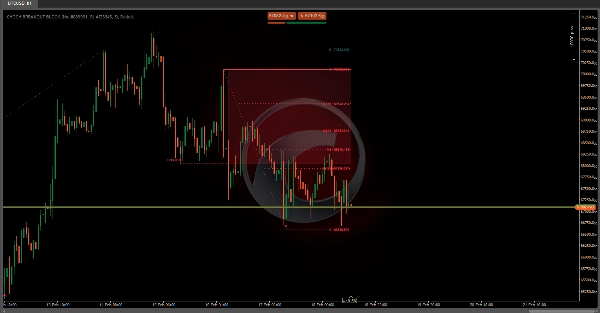
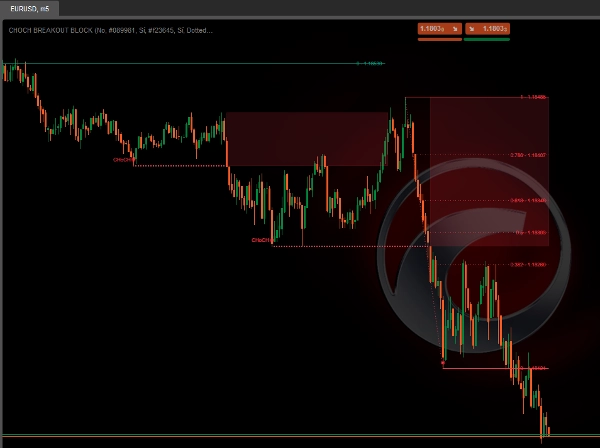
👁️ Jak widać na obrazie wykresu, półprzezroczyste czerwone strefy reprezentują te niedźwiedzie obszary zainteresowania po wykrytych zdarzeniach CHoCH.
📐 4. Automatyczne Poziomy Fibonacciego
Po wykryciu CHoCH wskaźnik NIE rysuje od razu Fibonacciego. Fibonacci pojawia się na drugim etapie, gdy rynek potwierdzi, że nowy kierunek ma rzeczywistą wagę strukturalną. Dzieje się to w dwóch krokach:
Krok 1 — Występuje CHoCH: 🏷️ Rysowana jest linia wybicia, etykieta i strefa zainteresowania. Fibonacci nie jest jeszcze widoczny.
Krok 2 — Rynek tworzy nowe długoterminowe wahnięcie w kierunku CHoCH: 📐 Dopiero wtedy wskaźnik automatycznie rysuje poziomy Fibonacciego między punktem odniesienia wybicia a tym nowo potwierdzonym wahnięciem.
📌 Przykład: W byczym CHoCH Fibonacci będzie rysowany od najniższego punktu znalezionego podczas wybicia do pierwszego długoterminowego szczytu, który rynek utworzy później. Jeśli cena rośnie, ale nie skonsolidowała jeszcze tego strukturalnego wahnięcia, poziomy Fibonacciego nie będą jeszcze widoczne — jest to celowe i nie jest błędem.
Po aktywacji poziomy rozszerzają się z każdą kolejną świecą, dopóki struktura pozostaje ważna, i są automatycznie przeliczane jeśli pojawi się nowe strukturalne wybicie. Dostępne poziomy to:
Poziom
Znaczenie ogólne
0
Początek ruchu
Niewielkie cofnięcie
⭐ Pierwsze istotne cofnięcie
0.5
⭐ Poziom środkowy
⭐ Złoty podział
Wariant złotego podziału
⭐ Głębokie cofnięcie
1
100% rozszerzenie
🕯️ 5. Wykrywanie Świecy Objęcia
Wskaźnik zawiera detekcję wzorca świecy objęcia jako dodatkowy sygnał zbieżności:
- ▲ Pojawia się bycze objęcie kiedy duża zielona świeca całkowicie pochłania poprzednią małą czerwoną świecę.
- ▼ Pojawia się niedźwiedzie objęcie kiedy duża czerwona świeca całkowicie pochłania poprzednią małą zieloną świecę.
Istnieją dwa tryby wyświetlania:
- 📋 Wszystkie: Pokazuje każdy wzorzec objęcia pojawiający się na wykresie.
- 🎯 StructureBased: Pokazuje tylko wzorce objęcia, które występują wewnątrz aktywnej strefy zainteresowania, znacznie zwiększając trafność sygnału.
Podsumowanie
When a CHoCH occurs, the indicator marks the breakout level with a horizontal line and label, and automatically creates a semi-transparent interest zone where price is likely to return before continuing in the new direction. This zone extends dynamically as long as price respects its boundaries and is invalidated if price breaks the opposite boundary.
The indicator also projects Fibonacci retracement levels automatically after the market confirms the new trend direction by forming a new long-term swing. Supported Fibonacci levels include 0.236, 0.382, 0.5, 0.618, 0.65, 0.786, and 1. Additionally, it detects bullish and bearish engulfing candle patterns as confluence signals, with options to display all patterns or only those occurring within active interest zones for higher precision.
This tool supports multiple markets including BTCUSD, EURUSD, GBPUSD, NZDUSD, XAUUSD, NAS100, and USDJPY.
Opinie klientów
5 | 100 % | |
4 | 0 % | |
3 | 0 % | |
2 | 0 % | |
1 | 0 % |


