
Opis
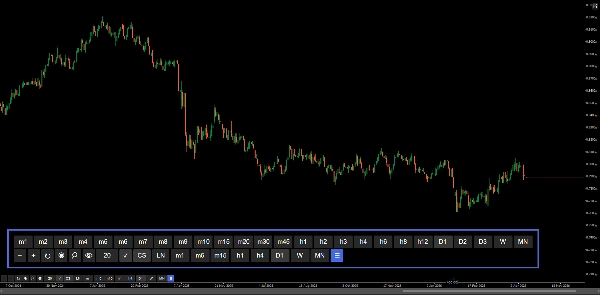
Panel sterowania wykresem dla szybszej nawigacji — powiększanie, ramy czasowe i konfiguracja wykresu bez opuszczania wykresu.
Ustawienia powiększenia, ręczne wprowadzanie powiększenia, pełny wybór ram czasowych i wykresów, konfigurowalne ulubione ramy czasowe, separatory okresów, siatka oparta na okrągłych liczbach oraz linie bid/ask na żywo — wszystko dostępne za pomocą przycisków interfejsu na wykresie. Zaprojektowane, aby skrócić czas spędzany na nawigacji w natywnych menu cTrader podczas aktywnych sesji handlowych.
CECHY
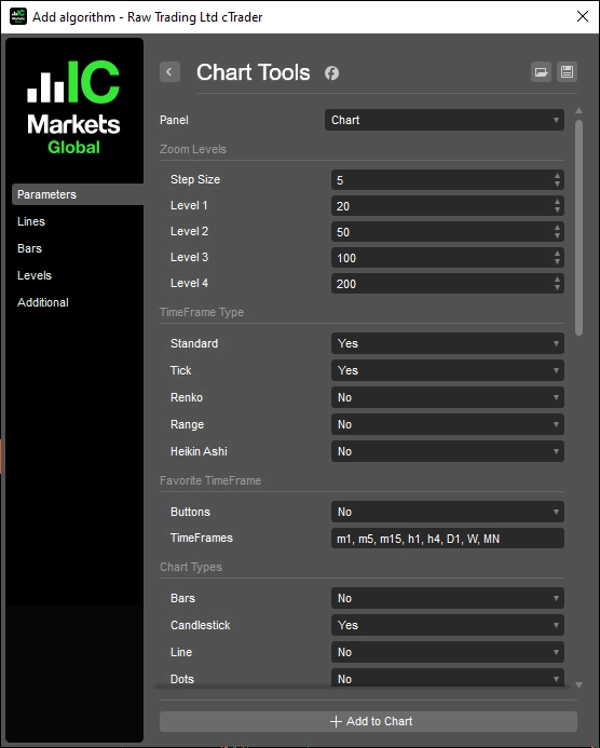
Kontrola powiększenia
- Powiększanie / pomniejszanie z konfigurowalnym krokiem
- Cztery konfigurowalne poziomy powiększenia do szybkiego dostępu jednym kliknięciem
- Ręczne wprowadzanie powiększenia z przyciskiem zastosowania
- Synchronizacja z natywnymi zdarzeniami powiększenia cTrader
Wybór ram czasowych
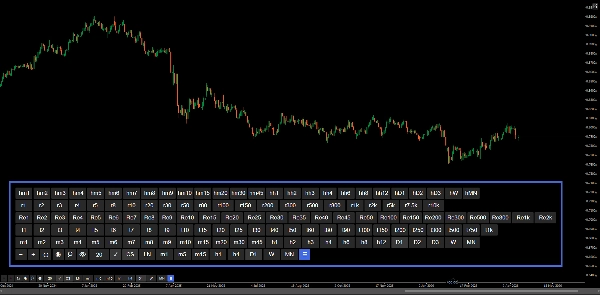
- Pełny panel przycisków obejmujący wszystkie typy ram czasowych: Standard, Heikin Ashi, Renko, Range, Tick
- Tryb Wszystkie wyświetla każdy typ jako osobne wiersze
- Aktywna ramka czasowa podświetlana automatycznie
- Przełączanie widoczności panelu przyciskiem ☰
Ulubione ramy czasowe
- Konfigurowalny wiersz szybkiego dostępu poprzez wprowadzanie oddzielone przecinkami (np. m1, h1, D1)
- Obsługuje wszystkie typy ram czasowych, w tym Range i Tick
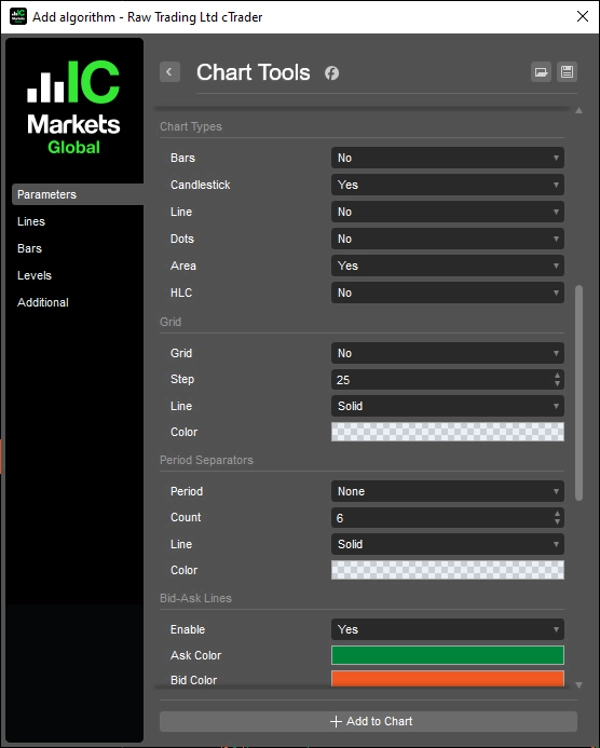
Typ wykresu
- Przyciski szybkiego przełączania dla: Bars, Candlestick, Line, Dots, Area, HLC
- Aktywny typ wykresu podświetlany automatycznie
- Każdy przycisk konfigurowalny indywidualnie za pomocą parametrów
Siatka
- Siatka oparta na okrągłych liczbach z konfigurowalnym interwałem pip (Mnożnik)
- Etykiety cen z inteligentnym formatowaniem dziesiętnym
- Linie rozciągają się na 10 słupków poza ostatni słupek
- Przełącznik włączania/wyłączania
Separatory okresów
- Separatory dzienne, tygodniowe, miesięczne i roczne
- Konfigurowalna liczba, kolor, styl linii i grubość
- Automatyczna aktualizacja podczas przewijania i powiększania
Linie Bid/Ask
- Linie bid i ask na żywo rozciągające się w nieskończoność
- Konfigurowalne kolory dla ask i bid
- Przełącznik włączania/wyłączania
Przyciski
- Pozycja: Prawy górny, Lewy górny, Prawy dolny, Lewy dolny
- Konfigurowalny margines
- Konfigurowalne kolory przycisków i tekstu — w tym stan aktywny, zastosowanie powiększenia i przycisk przełączania wykresu
__________________________________________________________________________________________
WIĘCEJ DARMOWYCH WSKAŹNIKÓW
Odkryj szeroki zakres narzędzi analizy rynku — od struktury i wolumenu po regresję, zmienność i niestandardowe ramy czasowe.
Kod źródłowy jest dostępny w repozytorium GitHub repository.
Wszystko dostępne za darmo. Ale jeśli chcesz wesprzeć kawą, możesz to zrobić tutaj.
Wsparcie/Oporność
Wolumen
- Volume Activity Profiler
- Volume Efficiency Analyzer
- Volume Profile Analytics
- Volume Profile - Updated
- Volume Spread Analysis
- VWAP (Volume Weighted Average Price)
Średnie kroczące
- SSL Channel
- Anchored Moving Average
- Deviation-Scaled Moving Average
- Gann High Low Activator
- Instantaneous Trendline
- Kaufman Adaptive MA with Trend Vision
- Moving Average Channel
- Moving Averages Suite
- Trend Channel Moving Average
Narzędzia/niestandardowe
Oparte na regresji
Zmienność
Oscylatory
__________________________________________________________________________________________
ZASTRZEŻENIE
Handel wiąże się z ryzykiem. Ten wskaźnik jest przeznaczony wyłącznie do analizy technicznej — zawsze stosuj odpowiednie zarządzanie ryzykiem i handluj odpowiedzialnie.
OPINIE I ULEPSZENIA
Jeśli masz sugestie, prośby o funkcje lub pomysły na ulepszenia, zostaw komentarz na karcie Dyskusja. Twoja opinia pomaga ulepszać wskaźnik dla wszystkich.
Podsumowanie
Users can configure a quick-access row of favorite timeframes supporting all timeframe types. The chart type switcher offers quick buttons for Bars, Candlestick, Line, Dots, Area, and HLC charts, each with individual configuration and automatic active state highlighting.
Additional features include a round numbers-based grid with configurable pip intervals and smart decimal formatting, daily to yearly period separators with customizable appearance, and live bid/ask lines extending indefinitely with color customization and toggle options.
The control panel’s buttons can be positioned in any corner of the chart with configurable margins and colors, including active states and zoom application. This tool aims to streamline active trading sessions by reducing time spent navigating native menus, supporting efficient technical analysis on various chart types and timeframes.
Opinie klientów
5 | 100 % | |
4 | 0 % | |
3 | 0 % | |
2 | 0 % | |
1 | 0 % |


