
Opis
Ulepszona wersja z kontrolą progu częściowego wypełnienia, precyzyjnym śledzeniem wieku oraz automatycznymi poziomami Fibonacciego na lukach.
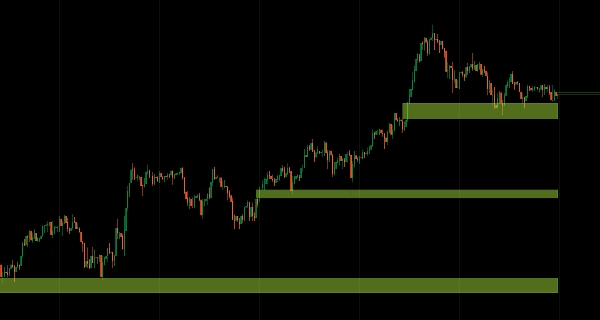
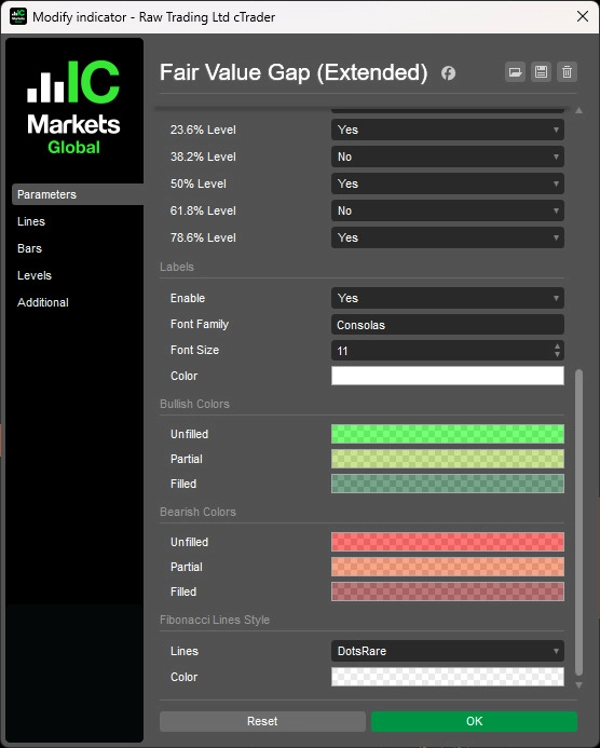
Automatycznie wykrywa bycze i niedźwiedzie luki z konfigurowalnym progiem częściowego wypełnienia (50-99%, domyślnie 90%), wyświetla wiek luki w formacie lat/miesięcy/tygodni/dni oraz prognozuje pięć poziomów Fibonacciego (23,6% do 78,6%) na częściowych i wypełnionych FVG.
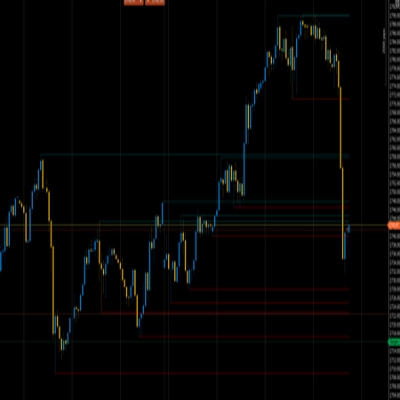
Skanowanie wieloczasowe w celu dopasowania strukturalnych luk HTF do akcji cenowej LTF, opcja rozszerzenia wypełnionych pudełek FVG do bieżącego słupka, nieograniczone wyświetlanie historycznych luk (ustawienie -1), dynamiczne aktualizacje statusu (niewypełnione/częściowo wypełnione/wypełnione) oraz minimalne, nieinwazyjne oznaczenia zapewniają kompleksową analizę nierównowagi płynności dla traderów celujących w wypełnienie luk z wykorzystaniem stref wejścia opartych na Fibonaccim.
CECHY
Ulepszona identyfikacja FVG
- Automatyczne znajdowanie byczych i niedźwiedzich luk Fair Value
- Śledzenie statusu niewypełnione, częściowo wypełnione i w pełni wypełnione w czasie rzeczywistym
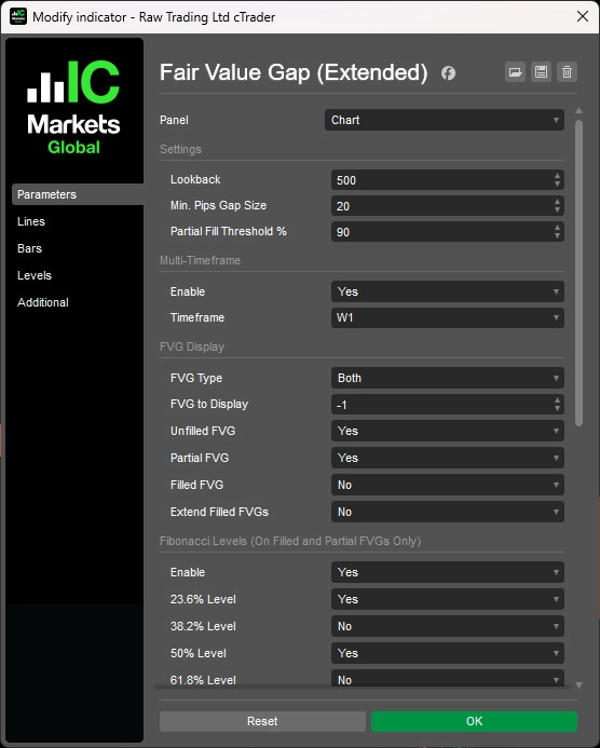
- Próg częściowego wypełnienia: kontrola momentu, kiedy częściowe wypełnienie staje się pełnym (50-99%, domyślnie 90%)
- Czysta wizualizacja z minimalnym zagraceniem wykresu
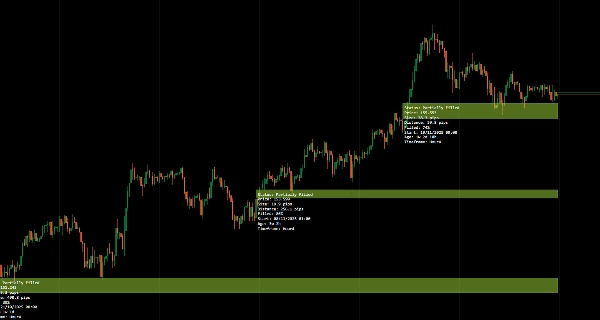
Ulepszony wyświetlacz wieku
- Pokazuje precyzyjny wiek luki w formacie lat, miesięcy, tygodni i dni (np. „3l 2t 4d”)
- Pomaga priorytetyzować świeże vs. przestarzałe luki do wyboru transakcji
- Kontekst czasowy poprawia podejmowanie decyzji o istotności luki
Śledzenie i wyświetlanie statusu
- Pokazuje aktualny status wypełnienia: niewypełnione, częściowo wypełnione lub w pełni wypełnione
- Dynamicznie aktualizuje się wraz z interakcją ceny z luką
- Wizualne potwierdzenie przechwycenia płynności
- Rozszerzanie wypełnionych FVG: opcja rozszerzenia pudełek wypełnionych FVG do bieżącego słupka dla odniesienia
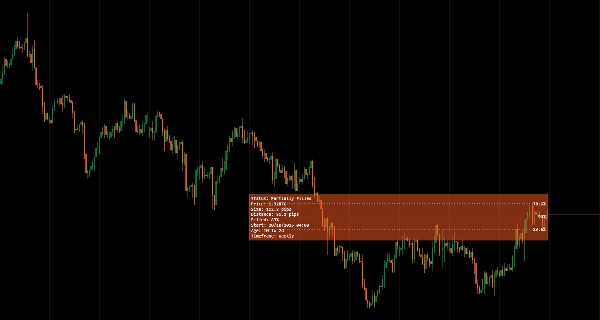
Poziomy Fibonacciego
- Automatyczne poziomy Fibonacciego (23,6%, 38,2%, 50%, 61,8%, 78,6%) wyświetlane na częściowych i wypełnionych FVG
- Eliminuje potrzebę ręcznego rysowania poziomów
- Precyzyjne strefy wejścia w lukach
- Proste strategie wejścia oparte na Fibonaccim
Tryb wieloczasowy
- Skanuj i wyświetlaj FVG z wyższych interwałów na wykresach niższych interwałów
- Dopasuj strukturalne luki HTF do akcji cenowej LTF
- Usprawnia analizę wieloczasową
Pokaż wszystkie FVG
- Ustaw „FVG do wyświetlenia” na -1, aby wyświetlić wszystkie historyczne FVG bez ograniczeń
- Pełna widoczność zachowania luk na wykresie
- Śledź wzorce wypełniania luk w czasie
Czysty, minimalistyczny interfejs
- Nieinwazyjne etykiety zaprojektowane dla przejrzystości
- Informacyjne, bez zagracania widoku cenowego
- Profesjonalna prezentacja dla skoncentrowanej analizy
__________________________________________________________________________________________
WIĘCEJ DARMOWYCH WSKAŹNIKÓW
Odkryj szeroki zakres narzędzi analizy rynku — od struktury i wolumenu po regresję, zmienność i niestandardowe interwały czasowe.
Kod źródłowy jest dostępny w repozytorium GitHub repository.
Wszystko dostępne za darmo. Ale jeśli chcesz wesprzeć kawą, możesz to zrobić tutaj.
Wsparcie/Oporność
Wolumen
- Volume Activity Profiler
- Volume Efficiency Analyzer
- Volume Profile Analytics
- Volume Profile - Updated
- Volume Spread Analysis
- VWAP (Volume Weighted Average Price)
Średnie kroczące
- SSL Channel
- Anchored Moving Average
- Deviation-Scaled Moving Average
- Gann High Low Activator
- Instantaneous Trendline
- Kaufman Adaptive MA with Trend Vision
- Moving Average Channel
- Moving Averages Suite
- Trend Channel Moving Average
Narzędzia/niestandardowe
Oparte na regresji
Zmienność
Oscylatory
__________________________________________________________________________________________
ZASTRZEŻENIE
Trading wiąże się z ryzykiem. Ten wskaźnik jest przeznaczony wyłącznie do analizy technicznej — zawsze stosuj odpowiednie zarządzanie ryzykiem i handluj odpowiedzialnie.
OPINIE I ULEPSZENIA
Jeśli masz sugestie, prośby o funkcje lub pomysły na ulepszenia, prosimy o pozostawienie komentarza na karcie Dyskusja. Twoja opinia pomaga ulepszyć wskaźnik dla wszystkich.
Podsumowanie
The indicator displays the precise age of each gap in years, months, weeks, and days, aiding traders in prioritizing fresh versus stale gaps. It projects five Fibonacci retracement levels (23.6%, 38.2%, 50%, 61.8%, 78.6%) on partial and filled gaps, providing predefined entry zones based on Fibonacci ratios without manual drawing.
Fair Value Gap (Extended) supports multi-timeframe analysis by scanning higher timeframe gaps and displaying them on lower timeframe charts, facilitating alignment of structural gaps with price action. It offers options to extend filled gap boxes to the current bar and to display unlimited historical gaps for comprehensive gap behavior tracking.
The indicator features a clean, minimal user interface with non-intrusive labels, delivering clear liquidity imbalance insights for traders focusing on gap fills and Fibonacci-based entries.
Opinie klientów
5 | 100 % | |
4 | 0 % | |
3 | 0 % | |
2 | 0 % | |
1 | 0 % |


![Logo „[Hamster-Coder] Pivot Points MTF”](https://cdn.ctrader.com/image/webp/4c143e5a-309c-40e3-a578-f04d1e133ffa_31159)


