Opis
ZAKTUALIZOWANA WERSJA PROFILU WOLUMETRII
W porównaniu do poprzedniej wersji, ta zaktualizowana wersja zawiera krytyczne poprawki błędów, nowe funkcje oraz znaczące ulepszenia wydajności:
Poprawki
- Naprawiona dystrybucja wolumenu: proporcjonalna alokacja oparta na nakładaniu się świec zamiast 100% na wszystkie dotknięte poziomy
- Naprawione wykrywanie VAH/VAL: tolerancja skalowana względem wysokości poziomu zamiast wartości na stałe
- Naprawione pozycjonowanie tekstu: dynamiczne przesunięcia oparte na interwale czasowym zamiast stałej liczby dni
- Naprawiona walidacja DateTime: sprawdzanie pustych słupków, walidacja zakresu
Funkcje
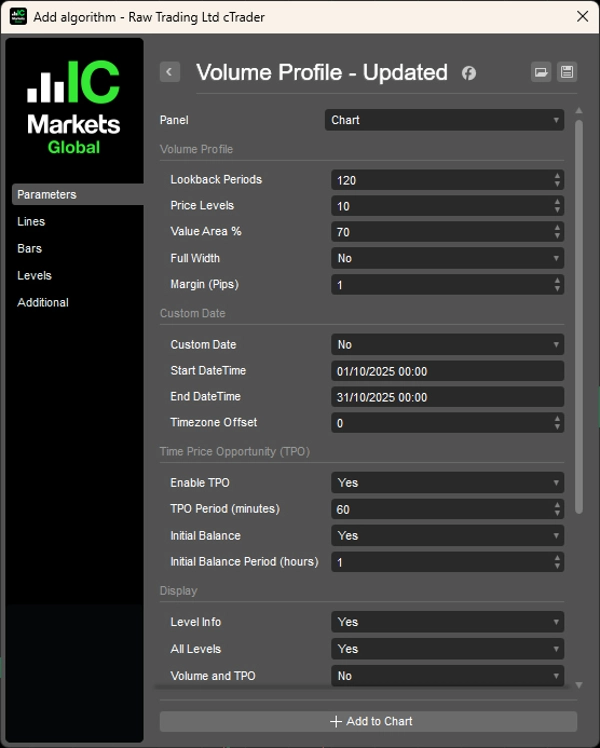
- Dodany parametr przesunięcia strefy czasowej dla profili DateTime
- Dodany parametr położenia tekstu (lewo/prawo) dla trybu lookback
- Etykiety trybu DateTime teraz podążają za krawędziami słupków (zmienna szerokość) lub wyrównują się do krawędzi profilu (pełna szerokość)
Wydajność
- Wyszukiwanie binarne dla indeksu DateTime (wcześniej liniowe O(n))
- Buforowane obliczanie całkowitego wolumenu (wcześniej przeliczane dla każdego poziomu)
- Wstępnie rozmiarowany słownik TPO, aby uniknąć zmiany rozmiaru
- Wzorzec TryGetValue dla wyszukiwań w słowniku
- Pętle oparte na indeksach zastępujące foreach w gorących ścieżkach
Czyszczenie
- Usunięty parametr ProfileWidth (auto-obliczany jest zawsze poprawny)
- Uproszczone przecięcie świec do pojedynczego warunku
__________________________________________________________________________________________
WAŻNE UWAGI - PRZECZYTAJ NAJPIERW
Wolumen Forex Nie Jest Rzeczywistym Wolumenem
Wolumen w forex to wolumen tickowy — liczy, ile razy zmieniła się cena. NIE liczy, ile pieniędzy zostało wymienionych.
Czego Wolumen Tickowy Nie Może Pokazać
- Wielkości transakcji. Transakcja za 100$ i za 10 000 000$ liczą się jako 1 tick.
- Rzeczywistego przepływu pieniędzy. Nie widać, czy cenę poruszyły duże czy małe pieniądze.
- Prawdziwej płynności. Nie widać, ile zleceń czeka na rynku.
- Aktywności banków. Banki widzą dane o rzeczywistym wolumenie. Ty nie.
Co To Oznacza
Wolumen tickowy pokazuje tylko, jak często zmieniała się cena — nie pieniądze za tym stojące. To powoduje problemy:
- Nie możesz śledzić banków ani instytucji. One używają danych o rzeczywistym wolumenie, do których nie masz dostępu.
- Nie możesz udowodnić teorii "smart money". Te idee potrzebują rzeczywistego wolumenu, nie liczby ticków.
- Nie możesz ocenić prawdziwej płynności. Aktywność ticków nie pokazuje głębokości zleceń ani siły rynku.
- Nie możesz zmierzyć rzeczywistej siły kupna lub sprzedaży. Wiele małych transakcji wygląda tak samo jak jedna duża instytucjonalna.
- Skoki wolumenu mogą wprowadzać w błąd. Skok może być tylko szumem algorytmicznym, a nie prawdziwym zainteresowaniem handlem.
Jak Poprawnie Używać Tego Wskaźnika
- Traktuj go jako miernik aktywności, nie pieniędzy. Wysoki wolumen tickowy = rynek jest zajęty. Niski wolumen tickowy = rynek jest spokojny. Nic więcej.
- Porównuj aktywność w różnych okresach. Używaj do sprawdzenia: Czy sesja londyńska jest bardziej aktywna niż nowojorska? Czy dziś jest bardziej aktywnie niż wczoraj? Czy okres trendu jest bardziej aktywny niż konsolidacja?
- Łącz go ze strukturą ceny. Używaj wsparcia/oporu, punktów zwrotnych lub BOS/ChoCH razem z wolumenem. Kontekst cenowy zapobiega fałszywym sygnałom z hałaśliwych skoków wolumenu.
- Obserwuj aktywność na ważnych poziomach cenowych. Gdy cena testuje kluczowy poziom i wolumen tickowy rośnie, oznacza to, że więcej traderów jest aktywnych. NIE oznacza to, że duzi gracze są zaangażowani.
- Nie zakładaj, że pokazuje aktywność instytucjonalną. Wolumen tickowy nie pokazuje akumulacji, dużych zleceń ani "smart money". Używaj go tylko do mierzenia rytmu i tempa.
__________________________________________________________________________________________
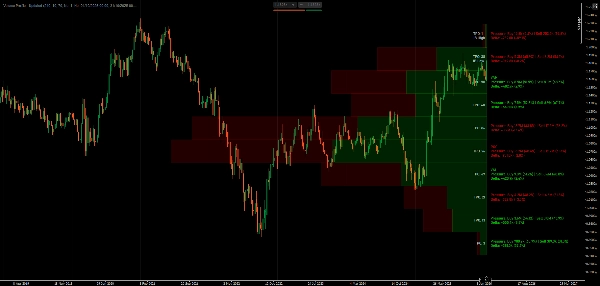
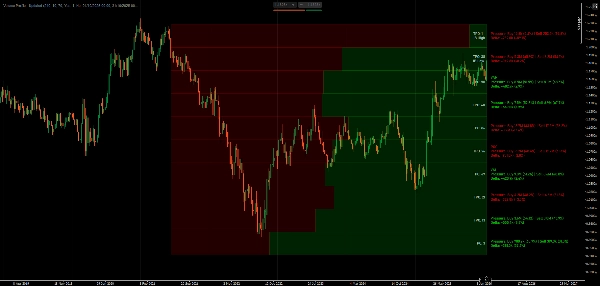
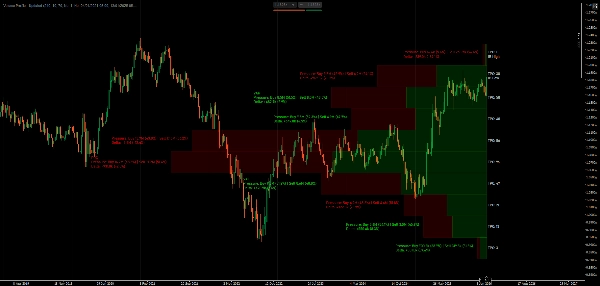
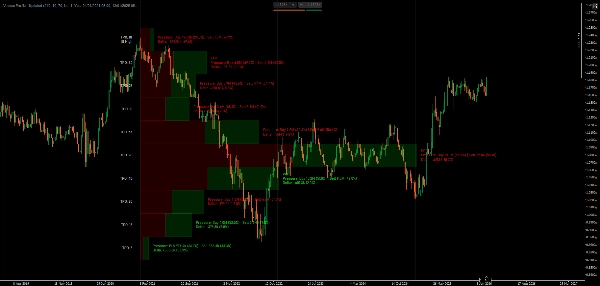
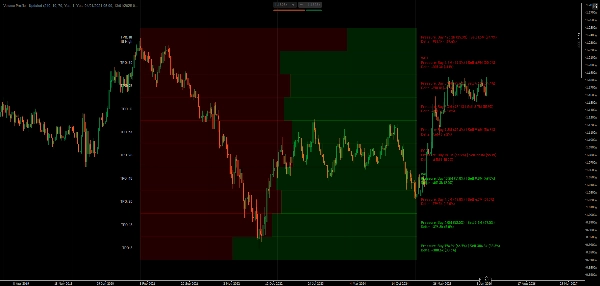
Wizualizuj dystrybucję wolumenu i czas spędzony przy cenie za pomocą POC, Value Area oraz śledzenia TPO Market Profile.
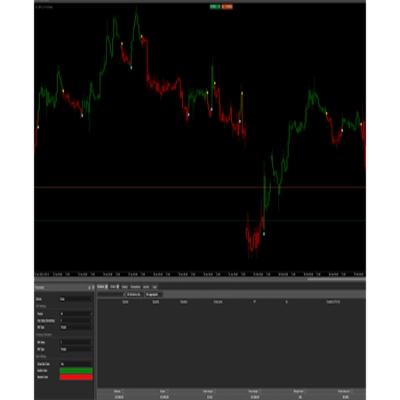
Ten wskaźnik pokazuje dystrybucję wolumenu używając koncepcji Market Profile. Wyświetla Punkt Kontroli (najwyższy poziom aktywności ticków), granice Value Area (gdzie odbyło się najwięcej handlu), sekwencje liter TPO (czas spędzony przy każdej cenie) oraz wizualizację delty, która dzieli aktywność ticków według kierunku świecy.
Możesz wybrać okresy lookback lub ustawić konkretne zakresy dat, wyświetlać słupki wolumenu jako proporcjonalne lub pełnej szerokości, przełączać się między wszystkimi poziomami lub tylko kluczowymi oraz dostosowywać kolory dla aktywności byków/niedźwiedzi.
FUNKCJE
Analiza Dystrybucji Wolumenu
- Punkt Kontroli (POC): Poziom cenowy z najwyższą aktywnością — gdzie cena spędziła najwięcej czasu
- Value Area (VA): Konfigurowalna strefa koncentracji aktywności (domyślnie 70%) — gdzie odbyło się najwięcej handlu
- VAH/VAL: Granice Value Area High/Low — potencjalne poziomy wsparcia/oporu
- Wizualizacja delty: Słupki dzielone pokazują kierunek świecy na każdym poziomie cenowym
Market Profile TPO
- Śledzenie Time Price Opportunity: Liczenie, ile okresów czasu handlowano na każdej cenie
- Litery TPO: Wizualna reprezentacja czasu spędzonego przy cenie (sekwencja A-Z)
- Initial Balance (IB): Zakres pierwszej godziny — ważny dla struktury day tradingu
- Markery IB High/Low: Ekstrema zakresu otwarcia
Elastyczne Opcje Lookback
- Oparte na okresie: Ustaw liczbę słupków do analizy (np. ostatnie 120 słupków)
- Zakres DateTime: Zakotwicz profil między konkretnymi datami/godzinami do analizy zdarzeń
- Dynamiczna szerokość: Profile automatycznie skalowane lub o stałej szerokości
Opcje Wyświetlania
- Słupki wolumenu: proporcjonalna szerokość (skalowana aktywnością) lub pełnej szerokości jednolite słupki
- Podział kierunku świecy w każdym słupku
- Obliczenia delty z procentami
- Przełączanie między wszystkimi poziomami lub tylko kluczowymi (POC, VAH, VAL)
- Kontrola widoczności szczegółów wolumenu/TPO
- Podział kierunkowy z procentami
- Regulowana wielkość czcionki i marginesy oparte na pipach
Dostosowanie Kolorów
- Niezależne kolory dla słupków kierunku byków/niedźwiedzi
- Oddzielne kolory tekstu dla dodatniej/ujemnej delty
- Kolor tekstu specyficzny dla TPO
Optymalizacja Wydajności
- Buforowane wyszukiwania czasu i efektywne rysowanie prostokątów
- Minimalne przeliczanie dla płynnej wydajności
- Profesjonalne obliczanie delty oparte na strukturze świecy
__________________________________________________________________________________________
WIĘCEJ DARMOWYCH WSKAŹNIKÓW
Odkryj szeroki zakres narzędzi analizy rynku — od struktury i wolumenu po regresję, zmienność i niestandardowe interwały czasowe.
Kod źródłowy jest dostępny w repozytorium GitHub .
Wszystko darmowe do użytku. Ale jeśli chcesz wesprzeć kawą, możesz to zrobić tutaj.
Wsparcie/Oporność
Wolumen
- Profiler Aktywności Wolumenu
- Analizator Efektywności Wolumenu
- Analiza Profilu Wolumenu
- Profil Wolumenu - Zaktualizowany
- Analiza Rozkładu Wolumenu
- VWAP (Wolumenowo ważona średnia cena)
Średnie Ruchome
- Kanał SSL
- Zakotwiczona Średnia Ruchoma
- Średnia Ruchoma skalowana odchyleniem
- Aktywator Ganna High Low
- Natychmiastowa Linia Trendu
- Adaptacyjna Średnia Ruchoma Kaufmana z Trend Vision
- Kanał Średniej Ruchomej
- Pakiet Średnich Ruchomych
- Średnia Ruchoma Kanału Trendu
Narzędzia/Custom
Oparte na Regresji
Zmienność
Oscylatory
__________________________________________________________________________________________
ZASTRZEŻENIE
Trading wiąże się z ryzykiem. Ten wskaźnik jest przeznaczony wyłącznie do analizy technicznej — zawsze stosuj odpowiednie zarządzanie ryzykiem i handluj odpowiedzialnie.
OPINIE I ULEPSZENIA
Jeśli masz sugestie, prośby o funkcje lub pomysły na ulepszenia, zostaw komentarz na karcie Dyskusja. Twoja opinia pomaga ulepszyć wskaźnik dla wszystkich.
Podsumowanie
Key features include customizable lookback periods based on bar count or specific date/time ranges, dynamic or fixed profile widths, and display options for proportional or full-width volume bars. Users can toggle visibility of all levels or key levels (POC, VAH, VAL) and adjust colors independently for bullish/bearish bars and delta text. The indicator tracks Initial Balance (IB) ranges and marks IB High/Low for day trading structure.
Performance optimizations include binary search for DateTime lookups, cached volume calculations, and efficient data structures to minimize recalculations. The indicator uses tick volume, which counts price changes rather than actual traded volume, making it suitable as a market activity meter rather than a measure of real money flow or liquidity.
Supported markets include Forex, Indices, Commodities, Crypto, and Stocks. The indicator is intended for technical analysis and includes parameters for timezone offset and text positioning.
Opinie klientów
5 | 100 % | |
4 | 0 % | |
3 | 0 % | |
2 | 0 % | |
1 | 0 % |