
Descrição
Reversão de 3 Barras
📊 O QUE É?
O 3-Bar Reversal é um indicador técnico que identifica padrões específicos de reversão formados por exatamente três velas consecutivas. Este padrão clássico sinaliza potenciais mudanças na direção do preço através de uma estrutura visual clara: uma vela de tendência, uma vela de exaustão e uma vela de reversão.
🎯 PARA QUE SERVE?
Este indicador ajuda os traders a:
- Detectar reversões de alta e baixa com estrutura de 3 velas
- Filtrar sinais falsos através de confirmação de tendência configurável
- Identificar zonas de suporte e resistência com base em padrões confirmados
- Visualizar oportunidades de negociação com marcadores intuitivos no gráfico
- Negociar reversões de alta probabilidade em qualquer timeframe
🔍 COMO FUNCIONA?
Padrão de Alta (Reversão de 3 Barras de Alta)
Estrutura de três velas:
- Vela 1 (Baixista): Fechamento abaixo da abertura - confirma pressão de venda
- Vela 2 (Exaustão baixista): Faz novas mínimas E novas máximas abaixo da vela 1, com fechamento baixista - sinal de capitulação ⚠️
- Vela 3 (Reversão de alta): Fechamento acima da abertura E máxima acima da máxima da vela 1 - confirma mudança de controle ✅
Padrão de Baixa (Reversão de 3 Barras de Baixa)
Estrutura oposta:
- Vela 1 (Altista): Fechamento acima da abertura - confirma pressão de compra
- Vela 2 (Extensão altista): Faz novas máximas E novas mínimas acima da vela 1, com fechamento altista - sinal de sobreextensão ⚠️
- Vela 3 (Reversão de baixa): Fechamento abaixo da abertura E mínima abaixo da mínima da vela 1 - confirma mudança de controle ✅
Sistema de Gestão Visual (Máquina de Estados)
O indicador processa cada padrão em três fases sequenciais:
FASE 1 - DETECÇÃO DO PADRÃO: 🔍
- A estrutura completa de 3 velas é identificada
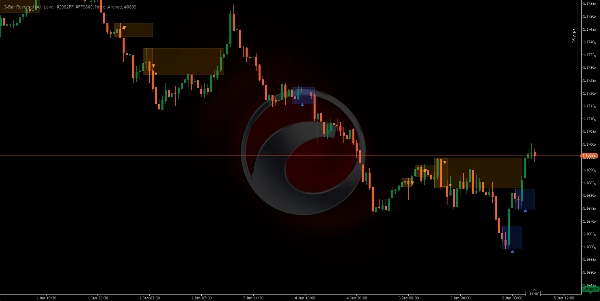
- Um indicador de triângulo (▲ altista / ▼ baixista) aparece na terceira vela
- Um retângulo semi-transparente de configuração é desenhado cobrindo:
-
- Alta: Da máxima da vela 1 até a mínima mais baixa (vela 2 ou 3)
- Baixa: Da mínima da vela 1 até a máxima mais alta (vela 2 ou 3)
- Este retângulo marca a "zona de batalha" onde a reversão ocorreu
FASE 2 - CONFIRMAÇÃO OU INVALIDAÇÃO: ⏳
O sistema espera a próxima vela após o padrão para validá-lo:
Confirmação de Alta: ✅
- O fechamento da próxima vela deve ultrapassar a máxima da vela 1 (teto do retângulo)
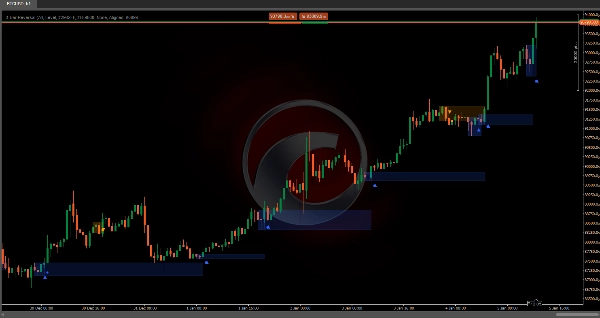
- Um ponto sólido (●) aparece marcando a confirmação
- O retângulo se torna uma zona de suporte ativa
Confirmação de Baixa: ✅
- O fechamento da próxima vela deve romper a mínima da vela 1 (piso do retângulo)
- Um ponto sólido (●) aparece marcando a confirmação
- O retângulo se torna uma zona de resistência ativa
Invalidação: ❌
- Falha de alta se: fechamento abaixo do mínimo do retângulo OU aparece padrão baixista
- Falha de baixa se: fechamento acima do máximo do retângulo OU aparece padrão altista
- O retângulo para de se estender (padrão morre)
Extensão de Espera: ⏸️
- Se não houver confirmação ou falha, o retângulo se estende horizontalmente vela a vela
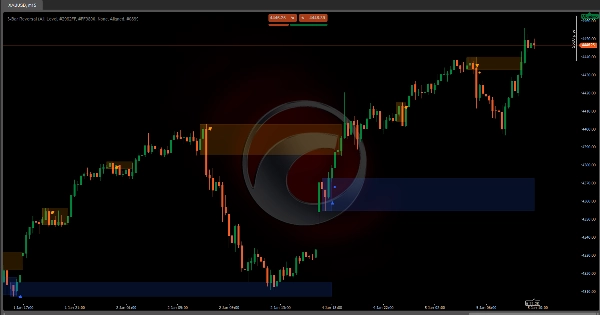
FASE 3 - ZONA ATIVA DE SUPORTE/RESISTÊNCIA: 🎯
- Uma vez confirmada, a zona se estende indefinidamente para a direita
- Zona de alta: Permanece ativa enquanto o preço ficar acima do piso
- Zona de baixa: Permanece ativa enquanto o preço ficar abaixo do teto
- A zona desativa quando o preço a rompe completamente na direção oposta
⚙️ CONFIGURAÇÃO PRINCIPAL
Modo de Padrão
Controla quais variações de padrão são aceitas:
- Normal: Aceita apenas quando a vela 3 fecha DENTRO do intervalo da vela 1
-
- Alta: Fechamento < máxima da vela 1 (reversão moderada)
- Baixa: Fechamento > mínima da vela 1 (reversão moderada)
- Avançado: Aceita apenas quando a vela 3 fecha FORA do intervalo da vela 1 🔥
-
- Alta: Fechamento > máxima da vela 1 (reversão explosiva)
- Baixa: Fechamento < mínima da vela 1 (reversão explosiva)
- Todos (Recomendado): Aceita ambos os tipos sem distinção ⭐
Tipo de Suporte/Resistência
- Nível: Funcionalidade básica de linha (limitada nesta versão)
- Zona: Desenha retângulos sombreados marcando zonas de SR após confirmação 📦
- Nenhum: Sem zonas de SR, apenas mostra padrões detectados
Cores Personalizáveis 🎨
- Cor da Reversão de Alta: Para triângulos, retângulos e zonas de alta (padrão:
#2962FF- azul) - Cor da Reversão de Baixa: Para triângulos, retângulos e zonas de baixa (padrão:
#FF9800- laranja) - Cor da Tendência de Alta: Para visualização do filtro de tendência (padrão:
#089981- verde) - Cor da Tendência de Baixa: Para visualização do filtro de tendência (padrão:
#F23645- vermelho)
🔧 FILTROS DE TENDÊNCIA
O indicador pode filtrar padrões com base na direção geral da tendência usando quatro métodos:
1. Nuvem de Médias Móveis ☁️
Usa duas médias móveis para identificar a tendência:
Parâmetros:
- Tipo de Média Móvel: Simples, Exponencial, Hull, Ponderada, etc. (padrão: Hull)
- Período Rápido: 50 (padrão)
- Período Lento: 200 (padrão)
Lógica do Filtro (Alinhado):
- Tendência de alta detectada quando: Preço > MA Rápida E MA Rápida > MA Lenta ✅
- Tendência de baixa detectada quando: Preço < MA Rápida E MA Rápida < MA Lenta ✅
- Mostra apenas padrões altistas em tendência de alta e padrões baixistas em tendência de baixa
Lógica Oposta (Oposto):
- Inverte condições para capturar reversões contrárias à tendência principal
2. Supertrend 📈
Indicador de seguimento de tendência baseado em volatilidade (ATR):
Parâmetros:
- Período ATR: 10 (padrão) - janela de cálculo da volatilidade
- Fator Multiplicador: 3.0 (padrão) - sensibilidade do indicador
Lógica:
- Calcula bandas superior e inferior usando ATR
- Preço acima do Supertrend = tendência de alta 🟢
- Preço abaixo do Supertrend = tendência de baixa 🔴
- Filtra padrões conforme alinhamento configurado
3. Canais Donchian 📊
Usa extremos de preço ao longo de um período:
Parâmetros:
- Comprimento do Canal: 13 (padrão)
Lógica:
- Canal superior = máxima mais alta dos N períodos
- Canal inferior = mínima mais baixa dos N períodos
- Ponto médio = (superior + inferior) / 2
- Preço acima do ponto médio = tendência de alta 🟢
- Preço abaixo do ponto médio = tendência de baixa 🔴
4. Nenhum (Sem Filtro) 🔓
Mostra TODOS os padrões de 3 barras detectados sem considerar a tendência geral. Útil para:
- Mercados em faixa
- Análise pura de padrões
- Negociação de reversão em qualquer contexto
Alinhamento de Tendência
Aplica-se quando o filtro está ativo:
- Alinhado: Mostra apenas padrões que seguem a tendência identificada ➡️
-
- Apenas padrões altistas em tendência de alta
- Apenas padrões baixistas em tendência de baixa
- Oposto: Mostra apenas padrões que vão CONTRA a tendência identificada 🔄
-
- Padrões altistas em tendência de baixa (reversão maior)
- Padrões baixistas em tendência de alta (reversão maior)
Resumo
It operates in three phases: pattern detection, confirmation or invalidation based on the next candle's behavior, and establishing active support or resistance zones that extend while price respects them. The indicator supports configurable pattern modes (Normal, Enhanced, or All) to control acceptance criteria for reversals.
Trend filtering is available through four methods—Moving Average Cloud, Supertrend, Donchian Channels, or no filter—allowing users to align pattern signals with overall market trends or capture counter-trend reversals. Confirmed reversal zones are displayed as shaded rectangles or levels, customizable in color for bullish and bearish signals, trend filters, and zones.
This tool is designed for use on any timeframe and across various markets, including forex pairs (EURUSD, GBPUSD, USDJPY, NZDUSD), commodities (XAUUSD), indices (NAS100), and cryptocurrencies (BTCUSD). It aids traders in detecting high-probability reversals, filtering false signals, and identifying support and resistance zones with clear visual markers.


