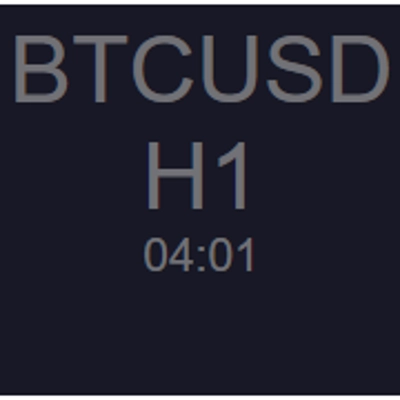
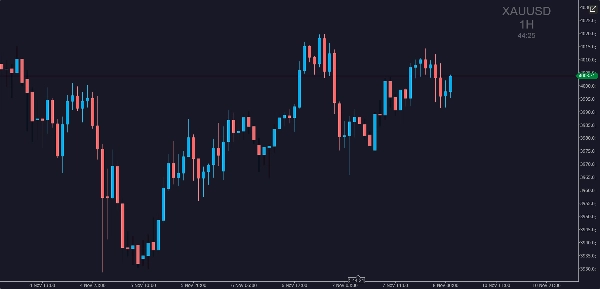
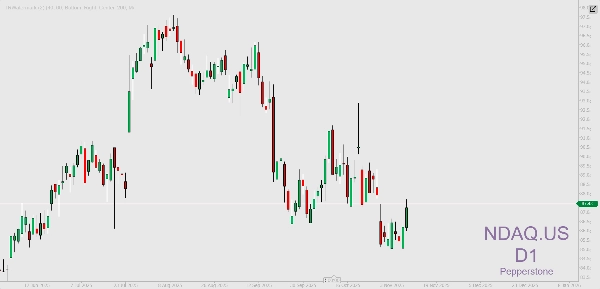
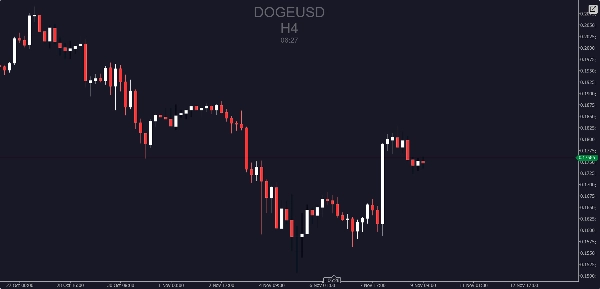
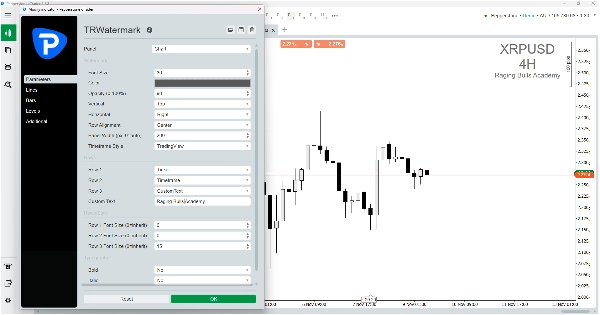
Indicador
NAS100
Indices
Prop
XAUUSD
Commodities
Stocks
Forex
Crypto
BTCUSD
TRWatermark_v1.0
Logótipo de "TRWatermark_v1.0"
09/11/2025
Desktop
Imagem carregada de "TRWatermark_v1.0"Imagem carregada de "TRWatermark_v1.0"Imagem carregada de "TRWatermark_v1.0"Imagem carregada de "TRWatermark_v1.0"Imagem carregada de "TRWatermark_v1.0"

TR Watermark (Top Right Watermark) is a customizable chart watermark for cTrader. It displays important chart information such as symbol, timeframe, or broker without covering price candles or drawings.


This indicator allows the watermark to be placed in any corner of the chart, providing flexibility for different layout preferences.


Features:

- Three configurable rows. Each row can display Timeframe, Symbol, Broker, Custom Text, Countdown, or be left empty.

- Supports both TradingView and MetaTrader timeframe formats.

- Adjustable position: top, middle, bottom and left, center, or right.

- Per-row font size and global font options.

- Countdown timer to show remaining time for the current candle.

- Adjustable opacity and alignment settings.


How to Use:

1. Add the indicator to the cTrader Automate workspace.

2. Click Build, then attach TR Watermark to any chart.

3. Configure the rows and styles according to your needs.

4. Optionally export the indicator as a .algo file.


About the Name:

TR Watermark stands for Top Right Watermark. It was developed to let traders view key chart information in the corner area instead of the center, keeping the chart data visible for analysis.


0.0
Avaliações: 0
Avaliações de clientes
Ainda não há avaliações para este produto. Já o experimentou? Seja o primeiro a contar a outras pessoas!
Também poderá gostar de
Rsi buy Sell Signal
Instant‑setup RSI scalper—designed for turbulent markets.
Indicador
NAS100
NZDUSD
XAUUSD
+10
Relative Moving Average
Bring the RMA to cTrader! This is the Relative Moving Average from TradingView.
VolumeRenkoRange
Volume for Renko/Range
Break of Structure
The Break of Structure (BoSCHoCh) Indicator is a smart market structure tool designed to help traders easily spot trend.
Indicador
Signal
MeetAlgo_ChannelTrading_cTrader
Channel Trading is a volatility-based indicator using envelope theory to spot price breakouts and trade signals.
Indicador
Indices
RSI
RSI
RSI Pro Tool – Overbought & Oversold Made Easy
Indicador
NAS100
NZDUSD
RSI
+11
Pattern Signal Forex
Indicator pattern signal moment
DMI MONDAY ZONES v2.1
Marks Monday's OPEN,HIGH & LOW. These are areas of support and resistance for the week.
Indicador
Indices
XAUUSD
Commodities
+5
cAlgoBuddy - Chaos Reversals
The cTrader Chaos Reversals indicator brings high-quality reversal signals to traders.
Indicador
NAS100
NZDUSD
Breakout
+12
Vwap_Quantum
Custom VWAP Indicator for cTrader
Indicador
Indices
Commodities
Stocks
+2
XY Bar Info Panel v1.5
Overlay panel showing bar date/time, OHLC, tick Volume, percent change, and market session - fully customizable.
Indicador
Grid
NAS100
RSI
+21
Market Cipher B
Market Cipher B
Indicador
XAUUSD
Commodities
ATR
+1
[Stellar Strategies] Visual Trend Momentum
Visual Trend Momentum is a MA/ATR/Volume trend tool. Visual signals for strong trends & reversals. Customizable. 📈📉
Indicador
Indices
RSI
Signal
Rsi + Volume
This indicator combines RSI (Relative Strength Index) with volume analysis to generate more reliable trading signals.
Indicador
NAS100
NZDUSD
XAUUSD
+11
TSI True Strength Index
Enhance trading with TSI! Use the True Strength Index for clear insights into market momentum and trend strength.
Indicador
NAS100
Indices
NZDUSD
+9
Supply and Demand
Auto Supply and Demand Automatically identifies the zones of highest trading activity on your chart. 📊
Indicador
RSI
Breakout
XAUUSD
+5
Zones Supply Demand
📊Zones Supply & Demand: Identifies key price levels with high volume concentration, marking Supply/Demand Zones & Marke
Indicador
Indices
RSI
Stocks
+5
REDGREENZONEREVERSAL
The Red & Green Zone Reversal Indicator detects overbought and oversold market conditions using Bollinger Bands and RSI.