
Descripción
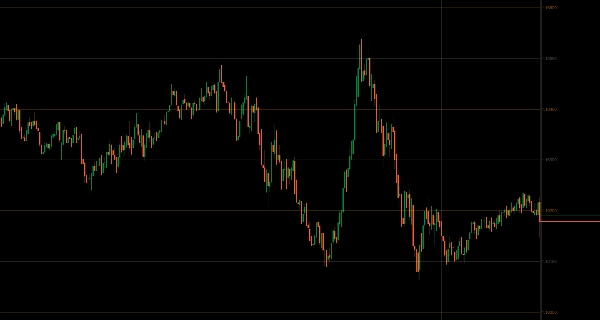
Niveles psicológicos auto-centrados alrededor del precio actual con sistema de visualización dual-múltiple.
Proyecta niveles primarios y alternativos de números redondos (pips/puntos configurables) dinámicamente a medida que el precio se mueve, manteniendo la relevancia contextual sin ajuste manual.
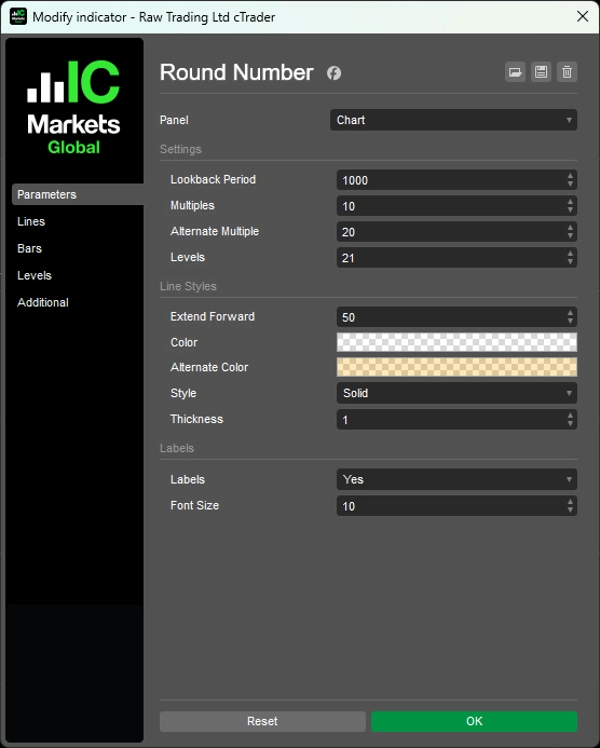
Sistema dual-múltiple para jerarquía visual (por defecto 10/20 pips), validación retrospectiva contra rango histórico (por defecto 1000 barras), conteo de niveles ajustable (por defecto 21) centrado en el precio, etiquetas de precio opcionales con control de tamaño de fuente, y proyección hacia adelante con distancia personalizable ofrecen seguimiento automático de niveles psicológicos para traders que buscan zonas naturales de soporte/resistencia y agrupaciones de órdenes en todos los marcos temporales.
CARACTERÍSTICAS
Visualización Auto-Centrada
- Siempre muestra niveles relevantes alrededor del precio actual—sin necesidad de ajuste manual
- Recalculación dinámica: se actualiza a medida que el precio se mueve para mantener niveles contextualmente relevantes
- Extensión inteligente: proyecta niveles hacia adelante con distancia personalizable
Sistema Dual-Múltiple
- Niveles primarios (por defecto 10 pips) para zonas estándar
- Niveles alternativos (por defecto 20 pips) para zonas principales
- Sistema de dos colores para jerarquía visual entre niveles primarios y principales
- Múltiplos configurables (pips, puntos o dólares según el instrumento)
Validación Retrospectiva
- Utiliza rango histórico (por defecto 1000 barras) para asegurar que los niveles sean contextualmente relevantes
- Valida la colocación de niveles contra el historial de precios
- Mantiene relevancia a través de diferentes condiciones de mercado
Personalización
- Conteo de niveles ajustable (por defecto 21) centrado en el precio
- Etiquetas de precio opcionales con tamaño de fuente ajustable
- Control completo de estilo: color, grosor, estilo de línea
- Presentación limpia sin dibujo manual de líneas
Utilidad Multi-Marco Temporal
- Los mismos niveles importan en todos los marcos temporales
- Funciona para scalping, trading diario y swing trading
- Soporte/resistencia natural y zonas institucionales
__________________________________________________________________________________________
MÁS INDICADORES GRATUITOS
Explora una amplia gama de herramientas de análisis de mercado—desde estructura y volumen hasta regresión, volatilidad y marcos temporales personalizados.
El código fuente está disponible en el repositorio de GitHub.
Todos son gratuitos para usar. Pero si deseas apoyar con un café, puedes hacerlo aquí.
Soporte/Resistencia
Volumen
- Perfilador de Actividad de Volumen
- Analizador de Eficiencia de Volumen
- Análisis de Perfil de Volumen
- Perfil de Volumen - Actualizado
- Análisis de Dispersión de Volumen
- VWAP (Precio Promedio Ponderado por Volumen)
Medias Móviles
- Canal SSL
- Media Móvil Anclada
- Media Móvil Escalada por Desviación
- Activador Gann High Low
- Línea de Tendencia Instantánea
- Media Móvil Adaptativa Kaufman con Visión de Tendencia
- Canal de Media Móvil
- Suite de Medias Móviles
- Media Móvil de Canal de Tendencia
Utilidades/Personalizados
Basado en Regresión
Volatilidad
Osciladores
__________________________________________________________________________________________
DESCARGO DE RESPONSABILIDAD
El trading implica riesgos. Este indicador está destinado únicamente para análisis técnico — siempre aplique una gestión de riesgos adecuada y opere con responsabilidad.
RETROALIMENTACIÓN Y MEJORAS
Si tienes sugerencias, solicitudes de funciones o ideas para mejoras, por favor deja un comentario en la pestaña de Discusión. Tu retroalimentación ayuda a mejorar el indicador para todos.
Resumen
Valoraciones de clientes
5 | 100 % | |
4 | 0 % | |
3 | 0 % | |
2 | 0 % | |
1 | 0 % |


