
Descrição
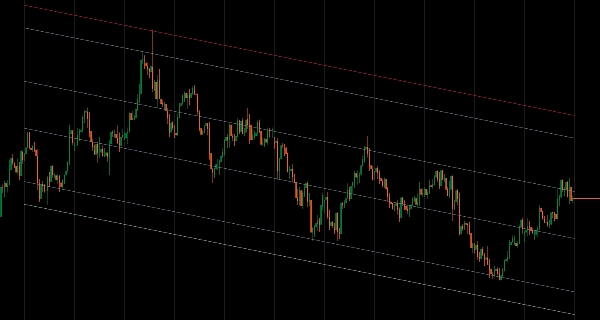
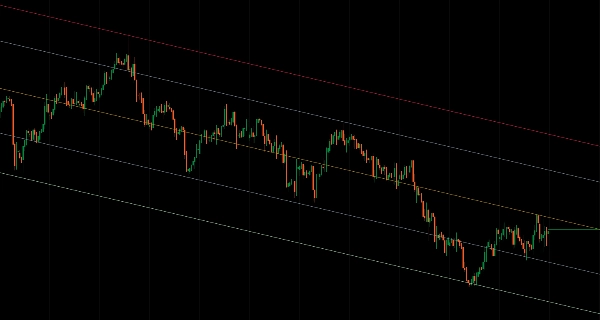
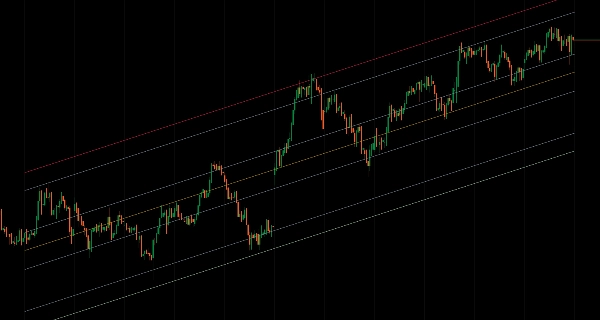
Canais de preço estatísticos com modos de cálculo flexíveis e renderização de bandas baseadas em desvio.
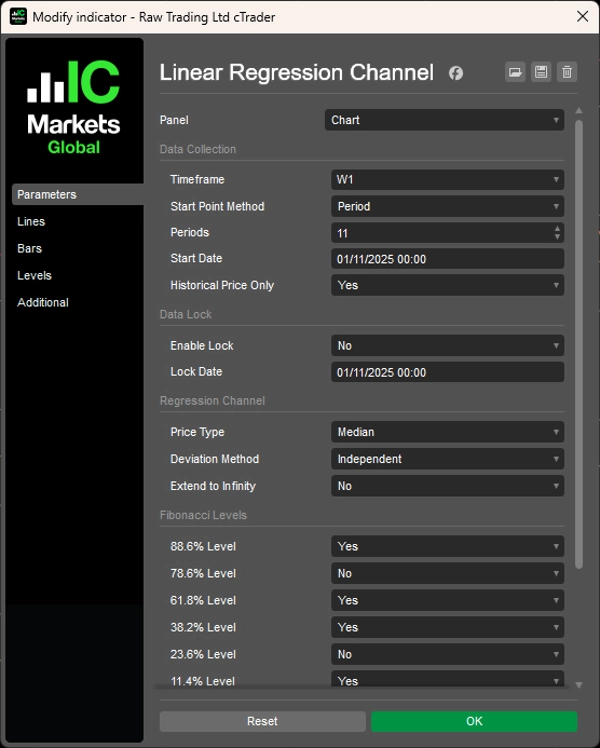
Ajusta linhas de regressão através dos dados de preço usando o Modo Período (últimos N candles), Modo DataHora (a partir de datas específicas) ou Mecanismo de Bloqueio para congelar a análise em pontos históricos enquanto o preço continua.
Três métodos de desvio (Média, Independente, Máximo) para canais simétricos e assimétricos, seis níveis de retração de Fibonacci (11,4% a 88,6%), análise multi-temporal, seis tipos de preço (Abertura/Alta/Baixa/Fechamento/Mediana/Típico), modo somente histórico para backtesting estável e projeção estendida ao infinito oferecem uma análise de regressão abrangente para traders que buscam zonas de reversão à média e limites estatísticos de preço em diferentes condições de mercado.
RECURSOS
Seleção de Dados Flexível
- Modo Período: Analise os últimos N candles (ex.: últimos 12 candles mensais)
- Modo DataHora: Inicie a partir de eventos ou datas específicas do mercado
- Mecanismo de Bloqueio: Congele a análise em um ponto histórico enquanto o preço continua
- Multi-Temporal: Desenhe regressão de qualquer timeframe no seu gráfico atual
Métodos Inteligentes de Desvio
- Média: Níveis equilibrados usando desvios médios — ideal para zonas de negociação
- Independente: Canais assimétricos que se adaptam à volatilidade direcional
- Máximo: Mostra limites extremos de preço para análise de alcance completo
Ferramentas Profissionais de Análise
- 6 níveis de retração de Fibonacci (11,4%, 23,6%, 38,2%, 61,8%, 78,6%, 88,6%)
- 6 tipos de preço: Abertura, Alta, Baixa, Fechamento, Mediana, Típico
- Modo somente histórico: Exclui candles em formação para backtesting estável
- Opção de estender ao infinito para projeções de longo prazo
Personalização Completa
- Personalização completa de cores para todos os elementos do canal
- Controle independente sobre a linha de regressão e bandas de desvio
- Apresentação visual limpa para análise focada
Capacidades Avançadas
- Recurso de bloqueio para estudos de análise baseados em eventos
- Combine estrutura de timeframe superior com execução em timeframe inferior
- Opções de canais simétricos e assimétricos para diferentes condições de mercado
__________________________________________________________________________________________
MAIS INDICADORES GRATUITOS
Explore uma ampla gama de ferramentas de análise de mercado — desde estrutura e volume até regressão, volatilidade e timeframes personalizados.
O código-fonte está disponível no repositório GitHub.
Todos gratuitos para uso. Mas se quiser enviar um suporte para café, você pode fazer isso aqui.
Suporte/Resistência
Volume
- Perfilador de Atividade de Volume
- Analisador de Eficiência de Volume
- Análise de Perfil de Volume
- Perfil de Volume - Atualizado
- Análise de Spread de Volume
- VWAP (Preço Médio Ponderado por Volume)
Médias Móveis
- Canal SSL
- Média Móvel Ancorada
- Média Móvel Escalonada por Desvio
- Ativador Gann High Low
- Linha de Tendência Instantânea
- Média Móvel Adaptativa Kaufman com Visão de Tendência
- Canal de Média Móvel
- Conjunto de Médias Móveis
- Média Móvel de Canal de Tendência
Utilitários/Personalizados
Baseado em Regressão
Volatilidade
Osciladores
__________________________________________________________________________________________
AVISO LEGAL
Negociar envolve riscos. Este indicador é destinado apenas para análise técnica — sempre aplique gerenciamento de risco adequado e negocie com responsabilidade.
FEEDBACK & MELHORIAS
Se você tiver sugestões, pedidos de recursos ou ideias para aprimoramento, por favor deixe um comentário na aba Discussão. Seu feedback ajuda a melhorar o indicador para todos.
Resumo
Avaliações de clientes
5 | 100 % | |
4 | 0 % | |
3 | 0 % | |
2 | 0 % | |
1 | 0 % |


