Opis
PRZEGLĄD
Instantaneous Trendline to wskaźnik techniczny opracowany przez Johna Ehlersa, inżyniera elektryka, który zastosował zasady cyfrowego przetwarzania sygnałów (DSP) do analizy rynków finansowych. Pierwotnie opublikowany w magazynie Stocks & Commodities (luty 2002) oraz szczegółowo opisany w jego książkach "Rocket Science for Traders" i "Cybernetic Analysis for Stocks and Futures", wskaźnik ten izoluje składnik trendu danych cenowych, filtrując składniki cykliczne (oscylujące).
KONCEPCJA
W przeciwieństwie do tradycyjnych średnich kroczących, które po prostu wygładzają dane cenowe, Instantaneous Trendline wykorzystuje techniki matematyczne zaczerpnięte z inżynierii elektrycznej do rozkładu ruchu cen na dwa odrębne składniki:
- Składnik trendu - Kierunkowe nastawienie rynku
- Składnik cyklu - Oscylujące wahania wokół trendu
Poprzez zastosowanie filtrów zaporowych i metodologii transformacji Hilberta, Ehlers stworzył wskaźnik, który szybko reaguje na rzeczywiste zmiany trendu, jednocześnie filtrując szumy i krótkoterminowe cykle. Efektem jest linia trendu, która dostosowuje się do warunków rynkowych z znacznie mniejszym opóźnieniem w porównaniu do prostych lub wykładniczych średnich kroczących o podobnych okresach.
Główną zaletą tego podejścia jest matematyczna precyzja w oddzielaniu tego, co jest "trendem", od tego, co jest "szumem cyklicznym", zamiast po prostu uśredniać cenę w stałym okresie retrospektywnym.
JAK TO DZIAŁA
Wskaźnik oblicza wygładzoną linię trendu za pomocą rekurencyjnego wzoru opartego na parametrze Alpha. Wzór uwzględnia:
- Aktualne i ostatnie dane cenowe (punkt środkowy HL/2)
- Poprzednie wartości linii trendu
- Współczynnik wygładzania Alpha (domyślnie 0.07)
Wskaźnik generuje również linię Trigger, która jest linią Instantaneous Trendline przesuniętą o 2 świece. Linia trigger jest używana do generowania sygnałów handlowych poprzez logikę przecięcia.
INTERPRETACJA
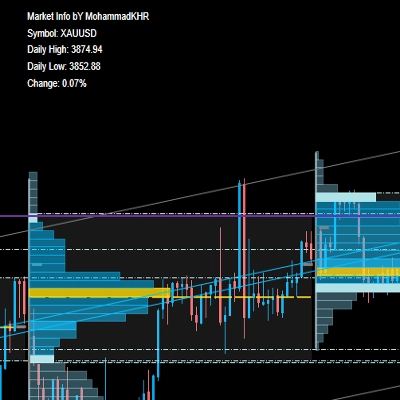
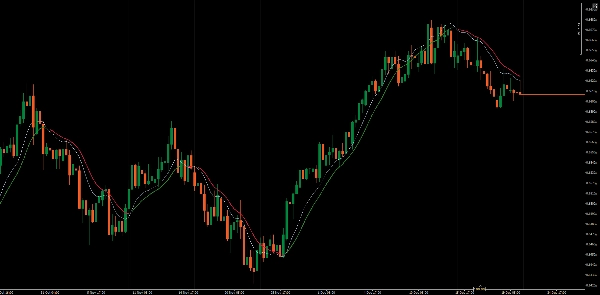
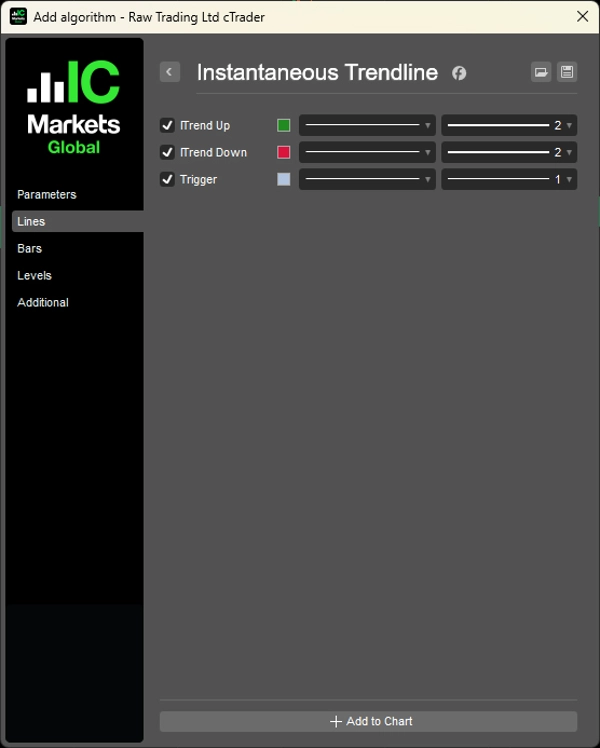
Wskaźnik rysuje trzy linie:
- ITrend Wzrostowy: Pokazywany, gdy Trigger > ITrend, wskazując warunki bycze
- ITrend Spadkowy: Pokazywany, gdy Trigger < ITrend, wskazując warunki niedźwiedzie
- Trigger: Wersja linii trendu opóźniona o 2 świece
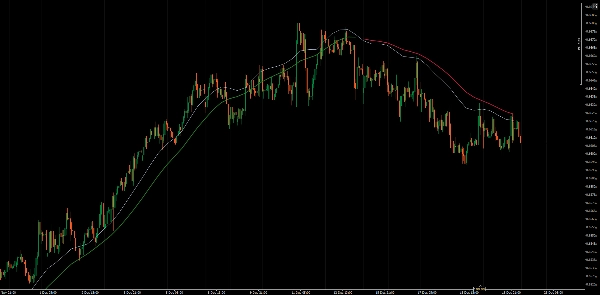
Generowanie sygnałów:
- Sygnał byczy: Gdy linia Trigger przecina linię Instantaneous Trendline od dołu
- Sygnał niedźwiedzi: Gdy linia Trigger przecina linię Instantaneous Trendline od góry
Wyświetlanie kodowane kolorami ułatwia szybkie rozpoznanie aktualnego kierunku trendu.
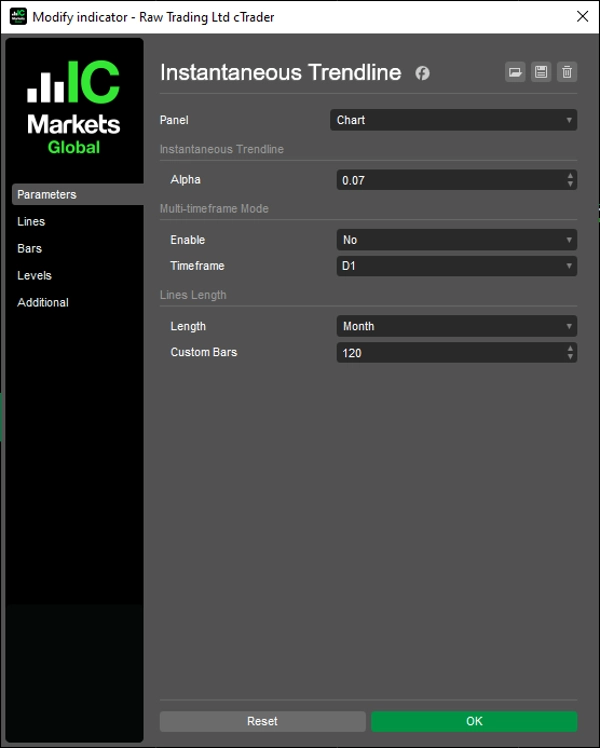
KLUCZOWE PARAMETRY
Alpha (0.01 - 1.0, domyślnie 0.07)
Kontroluje wygładzanie i szybkość reakcji linii trendu. Niższe wartości dają bardziej wygładzone, wolniej reagujące linie trendu odpowiednie dla trendów długoterminowych. Wyższe wartości zwiększają czułość na zmiany cen, ale mogą generować więcej fałszywych sygnałów na niestabilnych rynkach. Domyślna wartość 0.07 równoważy szybkość reakcji z filtrowaniem szumów.
Długość linii (domyślnie 120)
Określa, ile świec historycznych danych linii trendu jest wyświetlanych na wykresie. Pomaga to utrzymać wykres czytelny, zachowując jednocześnie wystarczający kontekst.
OGRANICZENIA
- Jak wszystkie narzędzia podążające za trendem, Instantaneous Trendline może generować fałszywe sygnały (whipsawy) na rynkach bocznych i konsolidujących się
- Podczas silnych trendów wskaźnik może utrzymywać Cię w trendzie dłużej, ale możesz przegapić dokładny szczyt lub dołek
- Wydajność znacznie różni się w zależności od warunków rynkowych (trend vs. konsolidacja)
- Wskaźnik jest reaktywny, a nie predykcyjny - identyfikuje trendy po ich rozpoczęciu
__________________________________________________________________________________________
WIĘCEJ DARMOWYCH WSKAŹNIKÓW
Odkryj szeroki zakres narzędzi analizy rynku — od struktury i wolumenu po regresję, zmienność i niestandardowe ramy czasowe.
Kod źródłowy jest dostępny w repozytorium GitHub repository.
Wszystko dostępne za darmo. Ale jeśli masz ochotę wesprzeć kawą, możesz to zrobić tutaj.
Wsparcie/Oporność
Wolumen
- Volume Activity Profiler
- Volume Efficiency Analyzer
- Volume Profile Analytics
- Volume Profile - Updated
- Volume Spread Analysis
- VWAP (Volume Weighted Average Price)
Średnie kroczące
- SSL Channel
- Anchored Moving Average
- Deviation-Scaled Moving Average
- Gann High Low Activator
- Instantaneous Trendline
- Kaufman Adaptive MA with Trend Vision
- Moving Average Channel
- Moving Averages Suite
- Trend Channel Moving Average
Narzędzia/niestandardowe
Oparte na regresji
Zmienność
Oscylatory
__________________________________________________________________________________________
ZASTRZEŻENIE
Handel wiąże się z ryzykiem. Ten wskaźnik jest przeznaczony wyłącznie do analizy technicznej — zawsze stosuj odpowiednie zarządzanie ryzykiem i handluj odpowiedzialnie.
OPINIE I ULEPSZENIA
Jeśli masz sugestie, prośby o funkcje lub pomysły na ulepszenia, prosimy o pozostawienie komentarza na karcie Dyskusja. Twoja opinia pomaga ulepszać wskaźnik dla wszystkich.
Podsumowanie
Opinie klientów
5 | 100 % | |
4 | 0 % | |
3 | 0 % | |
2 | 0 % | |
1 | 0 % |