
Opis
PRZEGLĄD
Podstawa: Zasady Wyckoffa
Ten wskaźnik opiera się na dwóch uzupełniających się koncepcjach z metodologii Wyckoffa:
1. Wysiłek vs Wynik
Podstawowa zasada Wyckoffa mówi, że ruch ceny (wynik) powinien być proporcjonalny do wolumenu, który go wspiera (wysiłek). Gdy wysiłek i wynik są zgodne, rynek zachowuje się normalnie. Gdy się rozchodzą, sygnalizuje to potencjalne punkty zwrotne lub siłę kontynuacji.
Ten wskaźnik bezpośrednio realizuje to poprzez Efektywność (wynik na jednostkę wysiłku) oraz jej odwrotność, Absorpcję (wysiłek nie przekładający się na wynik).
2. Analiza Zasięgu
Wyckoff podkreślał również analizę charakteru poszczególnych świec cenowych — badanie zasięgu (rozpiętości), miejsca zamknięcia ceny w tym zasięgu oraz czy świeca wykazywała zaangażowanie czy niezdecydowanie.
Ten wskaźnik realizuje analizę zasięgu poprzez Przekonanie (kierunkowe zaangażowanie), Wskaźnik Straty (cofnięcie w obrębie świecy) oraz Pozycję Zamknięcia (używaną do kontekstualizacji absorpcji jako akumulacji lub dystrybucji).
CO ROBI TEN WSKAŹNIK
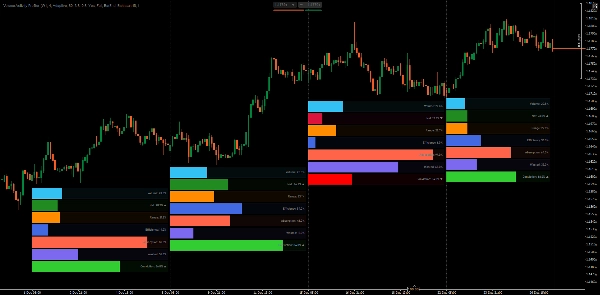
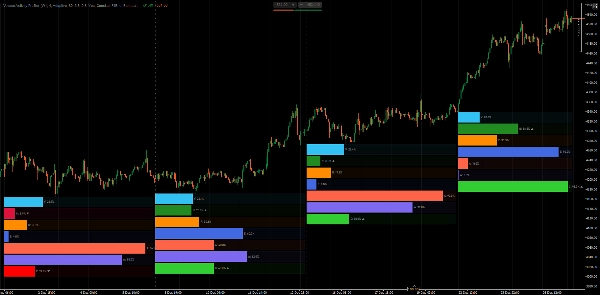
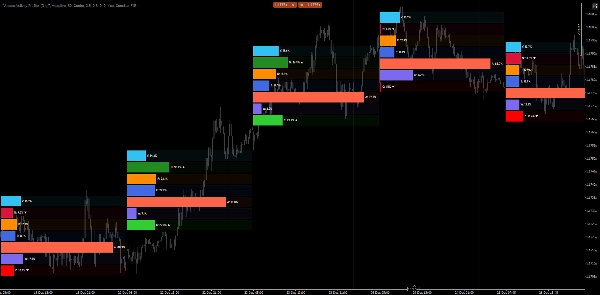
Volume Activity Profiler analizuje świece cenowe z wybranego interwału czasowego i rozkłada ich aktywność na mierzalne składniki. Oblicza zarówno surowe metryki, jak i pochodne metryki oparte na percentylach, a następnie wyświetla je jako poziome wykresy słupkowe umieszczone pod każdą analizowaną świecą.
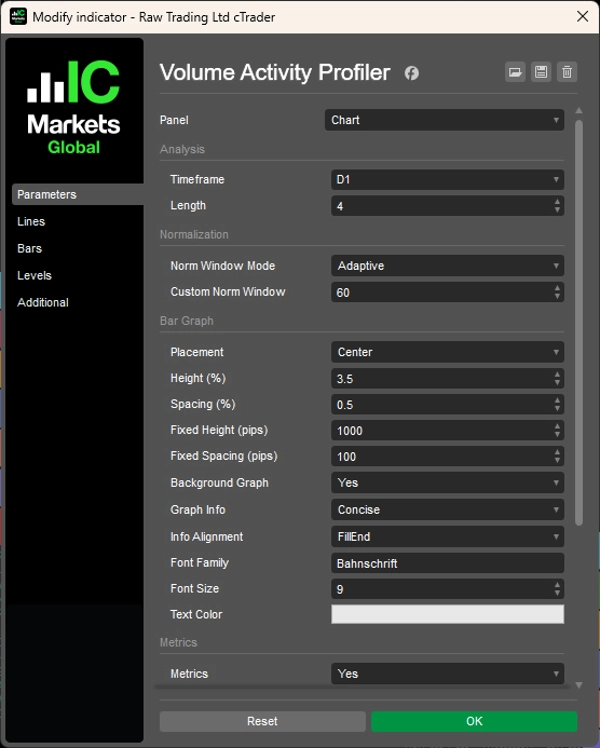
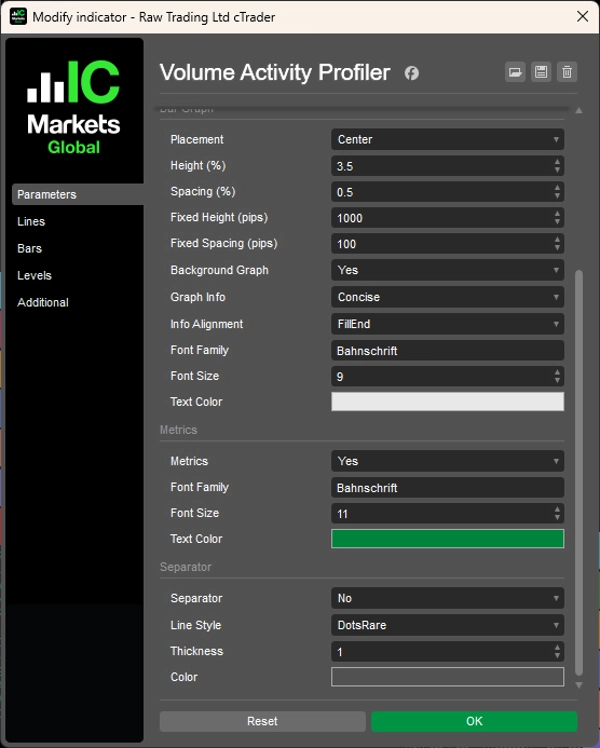
Konfigurujesz dwa główne parametry:
- Interwał czasowy: Interwał do analizy (np. tygodniowy, dzienny, H4)
- Długość: Ile świec profilować (np. ostatnie 4 świece)
Następnie wskaźnik profiluje każdą świecę w tym zakresie, obliczając metryki i porównując je między sobą oraz z historycznymi normami.
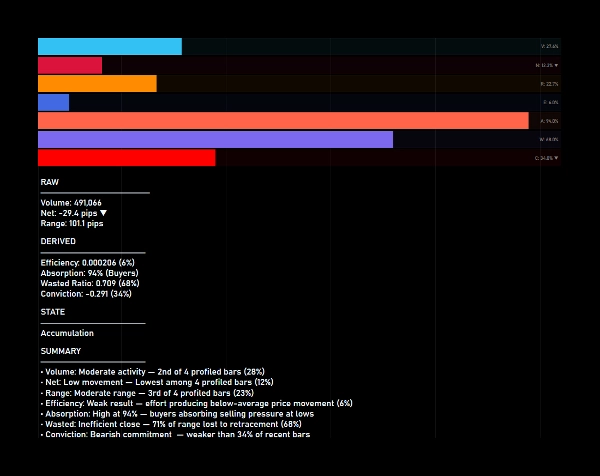
WYJAŚNIENIE METRYK
Surowe metryki (proporcjonalne względem profilowanych świec):
1. Wolumen
Wolumen ticków świecy. Pokazuje, jaki procent całkowitego profilowanego wolumenu stanowi ta świeca.
2. Netto
Ruch kierunkowy (zamknięcie − otwarcie) w pipsach. Pokazuje udział w całkowitym ruchu netto. Kolor wskazuje kierunek (zielony = wzrostowy, czerwony = spadkowy).
3. Zasięg
Całkowity zakres cenowy (maksimum − minimum) w pipsach. Pokazuje udział w całkowitym zasięgu wśród profilowanych świec.
Metryki pochodne (oparte na percentylach względem historycznego okna):
1. Efektywność (Wysiłek vs Wynik)
Zasięg wygenerowany na jednostkę wolumenu. Wysoka efektywność oznacza, że wysiłek przekłada się na ruch cenowy. Niska efektywność sugeruje absorpcję lub opór.
2. Absorpcja (Wysiłek vs Wynik)
Odwrotność efektywności. Wysoka absorpcja wskazuje, że wolumen jest absorbowany bez proporcjonalnego ruchu cenowego — potencjalna akumulacja lub dystrybucja.
3. Strata (Analiza Zasięgu)
Procent zasięgu utracony na cofnięcie (zasięg − netto) / zasięg. Wysoka strata oznacza, że świeca oddała dużą część swojego ruchu. Niska strata wskazuje na czystą, kierunkową świecę.
4. Przekonanie (Analiza Zasięgu)
Kierunkowe zaangażowanie mierzone jako netto/zasięg. Wysokie przekonanie oznacza, że świeca zamknęła się blisko swojego ekstremum. Niskie przekonanie wskazuje na niezdecydowanie lub odrzucenie.
ZROZUMIENIE WYKRESÓW SŁUPKOWYCH
Każda profilowana świeca wyświetla 7 poziomych słupków:
- Wolumen, Netto, Zasięg — Wypełnione na podstawie proporcji wśród profilowanych świec
- Efektywność, Absorpcja, Strata, Przekonanie — Wypełnione na podstawie rangi percentylowej względem danych historycznych
Słupek wypełniony w 80% w Efektywności oznacza, że efektywność tej świecy jest wyższa niż 80% świec w oknie normalizacji.
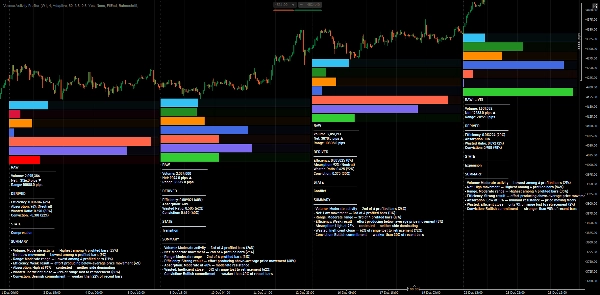
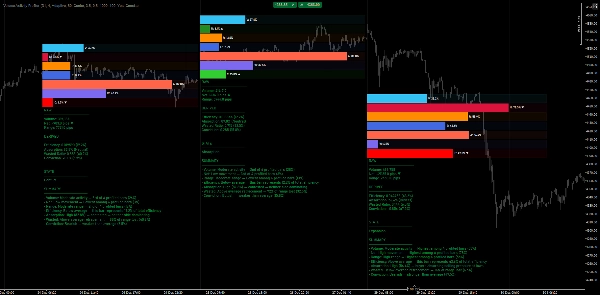
KLASYFIKACJA STANU AKTYWNOŚCI
Gdy wyświetlanie metryk jest włączone, wskaźnik klasyfikuje każdą świecę do jednego z tych stanów:
1. Kompresja
Niska efektywność + niskie przekonanie — cena się zwija, buduje się potencjalna energia
2. Ekspansja
Wysoka efektywność + wysokie przekonanie + niska strata — silny ruch kierunkowy
3. Konflikt
Wysoka strata + niskie przekonanie — walka między kupującymi a sprzedającymi
4. Akumulacja
Wysoka absorpcja + zamknięcie blisko minimów — kupujący absorbują presję sprzedaży
5. Dystrybucja
Wysoka absorpcja + zamknięcie blisko maksimów — sprzedający absorbują presję kupna
6. Odrzucenie
Wysokie przekonanie, ale zamknięcie przeciwne do kierunku — nieudany ruch, potencjalne odwrócenie
7. Przejście
Mieszane sygnały — rynek w przejściu między stanami
KORZYŚCI PRAKTYCZNE
- Szybka ocena wysiłku względem wyniku — Natychmiast zobacz, czy wolumen generuje proporcjonalny ruch, czy jest absorbowany.
- Analiza struktury wielointerwałowej — Analizuj świece z wyższych interwałów, pozostając na swoim interwale wykonawczym.
- Identyfikacja akumulacji/dystrybucji — Wysoka absorpcja z pozycjonowaniem zamknięcia ujawnia, gdzie mogą działać duzi gracze.
- Wykrywanie wyczerpania i odrzucenia — Wysokie przekonanie z przeciwną pozycją zamknięcia ostrzega przed potencjalnymi odwróceniami.
- Obiektywne porównanie świec — Rankingi i percentyle eliminują subiektywność ocen "wysokiego" lub "niskiego" wolumenu.
- Potwierdzanie wybicia — Stan ekspansji z wysoką efektywnością i przekonaniem potwierdza prawdziwe zainteresowanie wybiciem.
WOLUMIN TICKÓW JAKO PROXY WYSIŁKU
Ten wskaźnik używa wolumenu ticków jako wejścia wysiłku. Na rynku forex wolumen ticków reprezentuje częstotliwość zmian ceny, a nie faktyczny wolumen obrotu — jest to znane ograniczenie zdecentralizowanych rynków.
Mimo to wolumen ticków skutecznie służy jako proxy wysiłku, ponieważ:
- Odwzorowuje względną aktywność rynku między świecami
- Wysoka liczba ticków wskazuje na zwiększone zaangażowanie uczestników
- Relacja wysiłku do wyniku się utrzymuje — wysoka aktywność przy małym ruchu nadal sygnalizuje absorpcję
Rankingi percentylowe i porównania słupków pozostają ważne, o ile dane są spójne.
UWAGI
- Wskaźnik używa adaptacyjnych okien normalizacyjnych opartych na interwale czasowym, gdy ustawiony jest tryb Adaptacyjny, zapewniając odpowiedni kontekst historyczny.
- Obliczenia percentyli aktualizują się tylko na zakończonych świecach, aby uniknąć niestabilnych odczytów na formujących się świecach.
- Aktualnie formująca się świeca jest oznaczona jako [LIVE] w panelu metryk.
__________________________________________________________________________________________
WIĘCEJ DARMOWYCH WSKAŹNIKÓW
Odkryj szeroką gamę narzędzi analizy rynku — od struktury i wolumenu po regresję, zmienność i niestandardowe interwały czasowe.
Kod źródłowy jest dostępny w repozytorium GitHub repository.
Wszystko dostępne za darmo. Ale jeśli masz ochotę na wsparcie kawowe, możesz je przekazać tutaj.
Wsparcie/Oporność
Wolumen
- Volume Activity Profiler
- Volume Efficiency Analyzer
- Volume Profile Analytics
- Volume Profile - Zaktualizowany
- Volume Spread Analysis
- VWAP (Wolumenowa Średnia Ważona Ceną)
Średnie Kroczące
- Kanał SSL
- Zakotwiczona Średnia Krocząca
- Średnia Krocząca Skalowana Odchyleniem
- Aktywator Ganna High Low
- Natychmiastowa Linia Trendu
- Adaptacyjna Średnia Krocząca Kaufmana z Trend Vision
- Kanał Średnich Kroczących
- Pakiet Średnich Kroczących
- Średnia Krocząca Kanału Trendu
Narzędzia/Użytkowe
Oparte na Regresji
Zmienność
Oscylatory
__________________________________________________________________________________________
ZASTRZEŻENIE
Trading wiąże się z ryzykiem. Ten wskaźnik jest przeznaczony wyłącznie do analizy technicznej — zawsze stosuj odpowiednie zarządzanie ryzykiem i handluj odpowiedzialnie.
OPINIE I ULEPSZENIA
Jeśli masz sugestie, prośby o funkcje lub pomysły na ulepszenia, prosimy o pozostawienie komentarza na karcie Dyskusja. Twoja opinia pomaga ulepszać wskaźnik dla wszystkich.
Podsumowanie
The indicator profiles price bars over a user-selected timeframe and length, calculating raw metrics such as Volume (tick volume proportion), Net (directional price movement), and Range (price range). It also derives percentile-based metrics including Efficiency (price movement per volume unit), Absorption (volume without proportional price change), Wasted Ratio (retracement within the bar), and Conviction (directional commitment).
These metrics are visually represented as horizontal bar graphs beneath each analyzed bar, facilitating objective comparison and historical context. The indicator classifies bars into activity states like Compression, Expansion, Conflict, Accumulation, Distribution, Rejection, and Transition, aiding in identifying market phases and potential turning points.
Volume Activity Profiler uses tick volume as an effort proxy, reflecting relative market activity. It supports multi-timeframe analysis and updates percentile rankings on completed bars to ensure stable readings. This tool assists traders in assessing volume efficiency, spotting accumulation/distribution, confirming breakouts, and understanding market structure through quantitative volume and price bar analysis.
Opinie klientów
5 | 100 % | |
4 | 0 % | |
3 | 0 % | |
2 | 0 % | |
1 | 0 % |


