説明
重要な注意事項 - 最初にお読みください
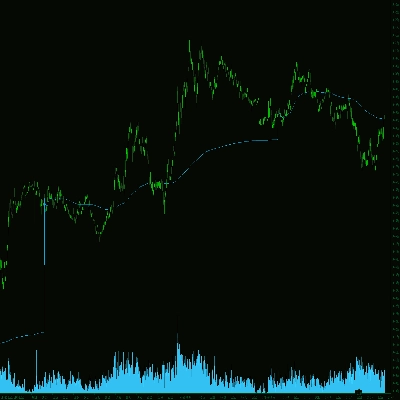
FXの出来高は実際の出来高ではありません
FXの出来高はティックボリュームです — 価格が変動した回数をカウントします。取引された金額はカウントしません。
ティックボリュームが示せないこと
- 取引サイズ。100ドルの取引も1,000万ドルの取引もどちらも1ティックとしてカウントされます。
- 実際の資金の流れ。大口資金か小口資金が価格を動かしたかはわかりません。
- 真の流動性。市場にどれだけの注文が待機しているかは見えません。
- 銀行の活動。銀行は実際の出来高データを見ています。あなたは見られません。
これが意味すること
ティックボリュームは価格がどれだけ頻繁に変動したかだけを示し、その背後にある資金の量は示しません。これには以下の問題があります:
- 銀行や機関を追跡できません。彼らはあなたがアクセスできない実際の出来高データを使用しています。
- 「スマートマネー」理論を証明できません。これらの考えはティック数ではなく実際の出来高が必要です。
- 真の流動性を判断できません。ティックの活動は注文の深さや市場の実際の強さを示しません。
- 実際の買いまたは売りの力を測定できません。多くの小さな取引は一つの大きな機関取引と同じように見えます。
- 出来高の急増は誤解を招くことがあります。急増は実際の取引興味ではなくアルゴリズムのノイズかもしれません。
このインジケーターの正しい使い方
- 資金のメーターではなく活動のメーターとして扱ってください。高いティックボリューム = 市場が活発。低いティックボリューム = 市場が静か。それ以上の意味はありません。
- 異なる時間帯の活動を比較してください。ロンドンセッションはニューヨークより忙しいか?今日は昨日より活発か?トレンド期間はレンジより忙しいか?を確認するために使います。
- 価格構造と組み合わせて使います。サポート/レジスタンス、スイングポイント、BOS/ChoCHとボリュームを一緒に使います。価格の文脈がノイズの多い出来高急増からの誤信号を防ぎます。
- 重要な価格レベルでの活動を観察します。価格が重要なレベルを試し、ティックボリュームが増加した場合、より多くのトレーダーが活動していることを意味します。大口プレイヤーが関与しているわけではありません。
- 機関の活動を示していると仮定しないでください。ティックボリュームは蓄積、大口注文、「スマートマネー」を示せません。リズムとテンポを測るためだけに使ってください。
__________________________________________________________________________________________
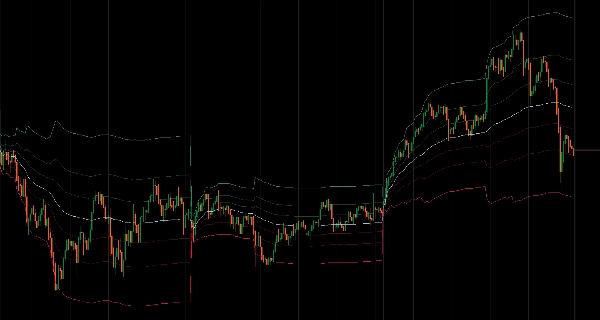
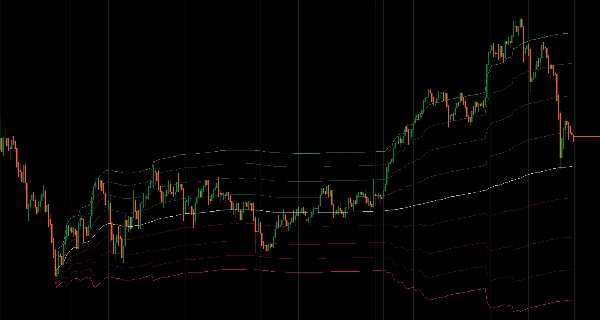
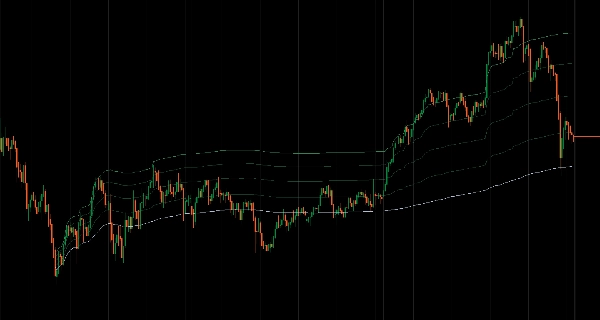
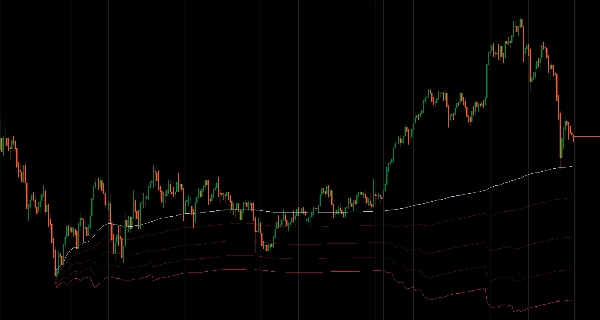
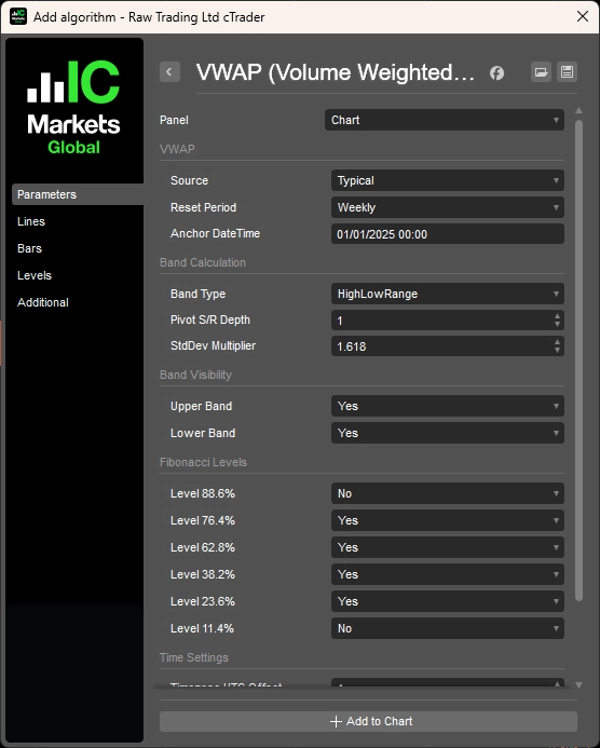
柔軟なリセット期間と3つのバンド計算方法を備えた出来高加重平均価格(VWAP)。
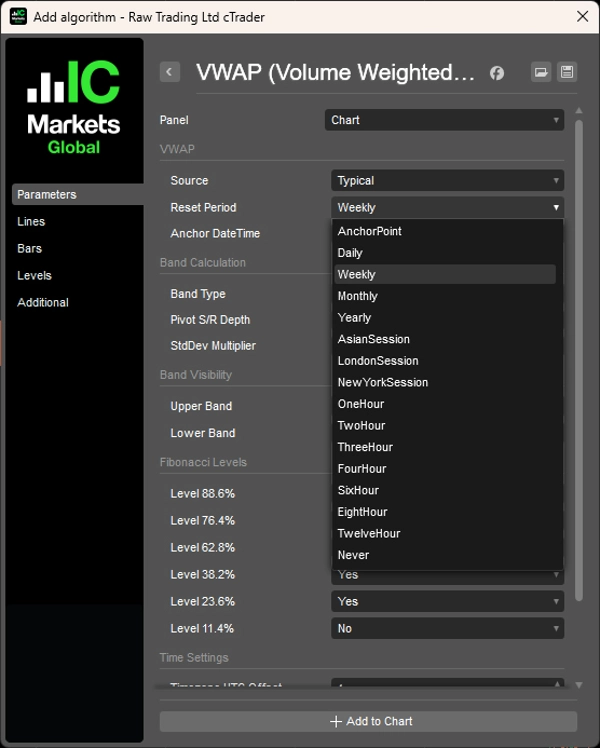
日次、週次、月次、年次、またはカスタムの時間ベース間隔を含む柔軟なリセット期間で出来高加重平均価格を計算します。アジア、ロンドン、ニューヨークのセッションベースのリセット(開始時間設定可能)、特定イベントにVWAPを固定するアンカーポイントモード、または利用可能なすべてのデータからのローリング計算も可能です。
3つのバンド計算方法を提供します:前期間の価格レンジに基づく高値/安値レンジ、古典的なピボット計算を用いたフィボナッチピボット、そしてボラティリティに応じて拡大・縮小する標準偏差バンドです。
8つのフィボナッチレベル(100%、88.6%、76.4%、62.8%、50%、38.2%、23.6%、11.4%、0%)を個別に表示切替可能で、上下バンドのグループコントロールによる迅速な調整が可能です。セッション管理にはUTCオフセット調整付きの正確な開始時間設定とタイムゾーン対応の時間リセット処理が含まれます。
特徴
- 柔軟なリセット期間
-
- 時間ベース:日次、週次、月次、年次、またはカスタムの時間間隔(1H、2H、3H、4H、6H、8H、12H)
- セッションベース:アジア、ロンドン、ニューヨークのセッション(開始時間とタイムゾーンオフセット設定可能)
- アンカーポイント:特定の日時にVWAPを固定し、イベント駆動分析に使用
- ローリング:リセットなしで利用可能なすべてのデータから計算
- 3つのバンド計算方法
-
- 高値/安値レンジ:前期間の価格レンジに基づくバンド
- フィボナッチピボット:前期間の高値/安値/終値からの古典的ピボット計算
- 標準偏差:ボラティリティに応じて拡大・縮小する伝統的な統計バンド
- 完全なフィボナッチレベル制御
-
- 8つのカスタマイズ可能なレベル:100%、88.6%、76.4%、62.8%、50%(VWAP)、38.2%、23.6%、11.4%、0%
- 個別のレベル表示切替
- 上下バンドのグループコントロールによる迅速な調整
- セッション管理
-
- UTCオフセット調整付きの正確なセッション開始時間設定(-12から+14時間)
- 現在のリセットスケジュールを表示する視覚的なセッション情報表示
- タイムゾーン対応の時間リセット処理
- パフォーマンス最適化
-
- 遅延計算 — バンドは表示時のみ計算
- インテリジェントなキャッシュとバッチ処理
- すべてのレベルが有効でもCPU負荷は最小限
__________________________________________________________________________________________
その他の無料インジケーター
構造や出来高から回帰、ボラティリティ、カスタム時間枠まで、幅広い市場分析ツールを探索してください。
ソースコードはGitHub リポジトリで入手可能です。
すべて無料で使用できますが、コーヒーサポートを送りたい場合は こちらからどうぞ。
サポート/レジスタンス
出来高
移動平均
- SSLチャネル
- アンカード移動平均
- 偏差スケール移動平均
- ギャン高安アクティベーター
- 瞬時トレンドライン
- トレンドビジョン付きカウフマン適応MA
- 移動平均チャネル
- 移動平均スイート
- トレンドチャネル移動平均
ユーティリティ/カスタム
回帰ベース
ボラティリティ
オシレーター
__________________________________________________________________________________________
免責事項
取引にはリスクが伴います。このインジケーターはあくまでテクニカル分析用であり、常に適切なリスク管理を行い、責任を持って取引してください。
フィードバックと改善
ご提案、機能リクエスト、改善案がありましたら、ディスカッションタブにコメントをお寄せください。皆様のフィードバックがインジケーターの改善に役立ちます。
概要
The indicator offers three band calculation methods: High/Low Range bands based on the previous period's price range, Fibonacci Pivot bands using classical pivot calculations, and Standard Deviation bands that adjust with market volatility. Users can customize eight Fibonacci levels (ranging from 0% to 100%) with individual visibility toggles and group controls for upper and lower bands.
Session management features include precise start time configuration with UTC offset adjustments and timezone-aware hourly resets, along with visual session information display. Performance optimizations include lazy calculation of bands only when visible, intelligent caching, and batch processing to minimize CPU usage.
Note: For forex markets, volume data represents tick volume (price change counts) rather than actual traded volume, so this indicator should be used as a measure of market activity rather than real money flow. It is intended for technical analysis with proper risk management.
カスタマーレビュー
5 | 100 % | |
4 | 0 % | |
3 | 0 % | |
2 | 0 % | |
1 | 0 % |