
Order Block with Volume
Wskaźnik
7 zakupy
Wersja 1.0, Mar 2026
Windows, Mac
5.0
Opinie: 1
Opis
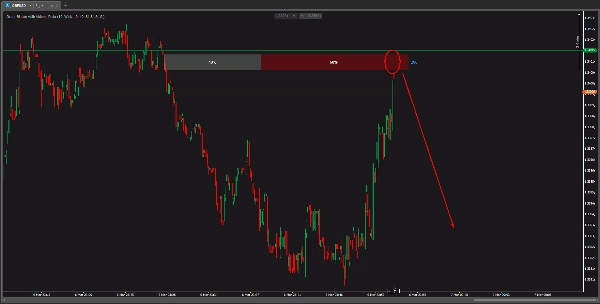
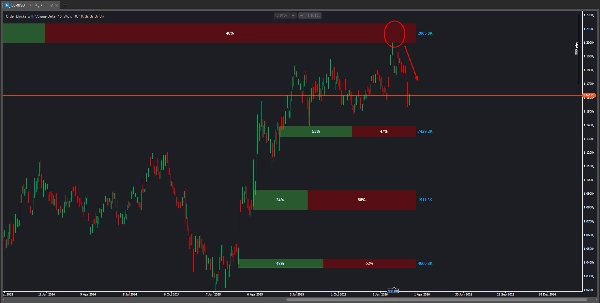
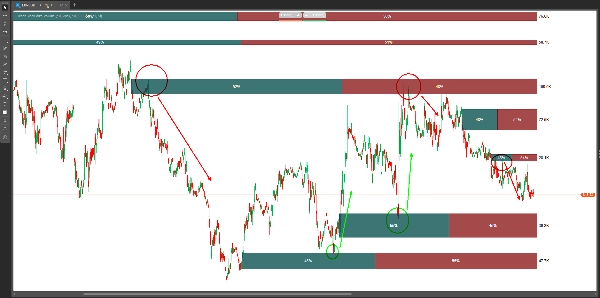
Bloki zleceń z deltą wolumenu 💎
Ten zaawansowany wskaźnik identyfikuje strefy podaży i popytu, analizując instytucjonalne intencje stojące za każdym ruchem. Korzystając z czystej akcji cenowej i metryk wolumenu, dokładnie wskazuje, gdzie znajduje się "Smart Money". Jest to uniwersalne narzędzie zaprojektowane do działania na dowolnym aktywie (Forex, Indeksy, Kryptowaluty, Surowce) na wszystkich interwałach czasowych.
Strategia wykonania: opanowanie wejścia 🎯
Aby zmaksymalizować precyzję wskaźnika i osiągnąć wysokie cele RR, przestrzegaj tych profesjonalnych zasad wykonania:
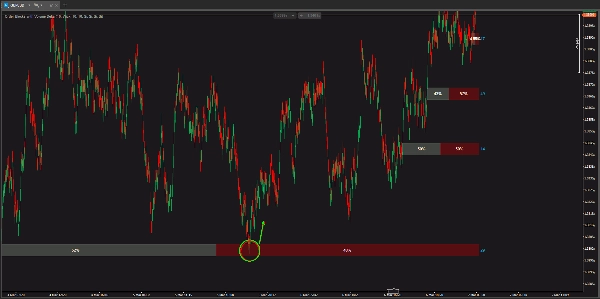
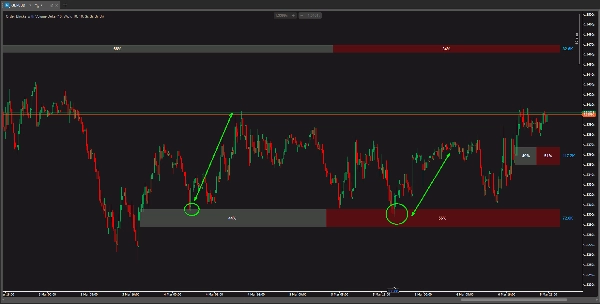
- Wejście (Wykonanie): Nie wchodź na ślepo. Poczekaj, aż cena wróci do oznaczonej strefy (mitigacja). Idealne wejście następuje na 50% bloku zleceń (średni próg) lub na początku strefy, jeśli Delta Wolumenu wykazuje agresywną dominację (powyżej 70%).
- Ustawienie Stop Loss (SL): Dla solidnej ochrony umieść SL 2-3 pipsy/ticki poza zewnętrznym limitem bloku zleceń. Zapewnia to wystarczająco dużo "przestrzeni oddechowej" przeciwko zmiotkom płynności.
- Zarządzanie ryzykiem do zysku (RR): * Docelowy stosunek: Zawsze dąż do minimum 1:3.
-
- Elitarny potencjał: Poprzez dopracowanie wejść na niższych interwałach (M1/M5) wewnątrz bloku zleceń na wyższym interwale (H1/H4), całkowicie możliwe jest osiągnięcie stosunków 1:10. Pozwala to ryzykować 1% konta, aby zyskać 10% w jednym ruchu.
Wysokie prawdopodobieństwo konfluencji (formuła 1:10) 🚀
- Wyrównanie HTF: Handluj tylko blokami zleceń zgodnymi z trendem wyższego interwału czasowego (HTF).
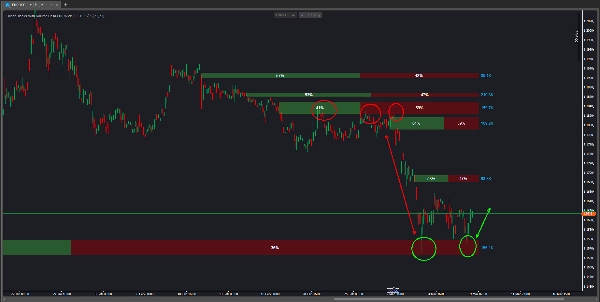
- Potwierdzenie wolumenu: Szukaj skoku Delty Wolumenu (intensywny kolor) gdy cena po raz pierwszy tworzy blok. Potwierdza to udział instytucjonalny.
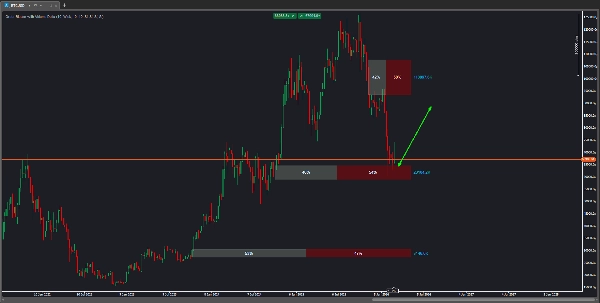
- Zmiotki płynności: Najlepsze transakcje mają miejsce po tym, jak cena "polowała" na poprzednie maksima lub minima, zanim uderzyła w twój blok zleceń.
Jak to działa? 🛠️
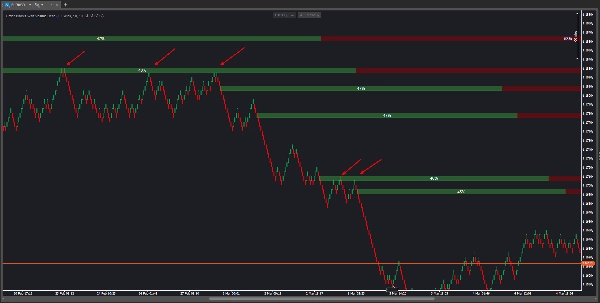
- Wykrywanie struktury: Identyfikuje punkty zwrotne (Swing High/Low) w celu wykrycia przełamania struktury (BOS).
- Tworzenie bloku: Automatycznie oznacza strefę bloku zleceń po znaczącym ruchu instytucjonalnym.
- Analiza Delty Wolumenu: Rozkłada całkowity wolumen na procenty kupna i sprzedaży, aby potwierdzić siłę.
- Zarządzanie dynamiczne: Strefy pozostają aktywne, dopóki nie zostaną zmitigowane przez cenę lub unieważnione.
Kluczowe cechy ✨
- 📊 Delta Wolumenu: Wizualizuj rzeczywistą dominację kupujących lub sprzedających w strefie.
- 💰 Metryki wolumenu (K): Wyświetla całkowity skumulowany wolumen (np. 82.6K), aby ocenić instytucjonalną wagę strefy.
- 🛡️ Filtr unieważnienia: Wybierz, czy strefa jest unieważniona przez dotknięcie knota czy zamknięcie świecy.
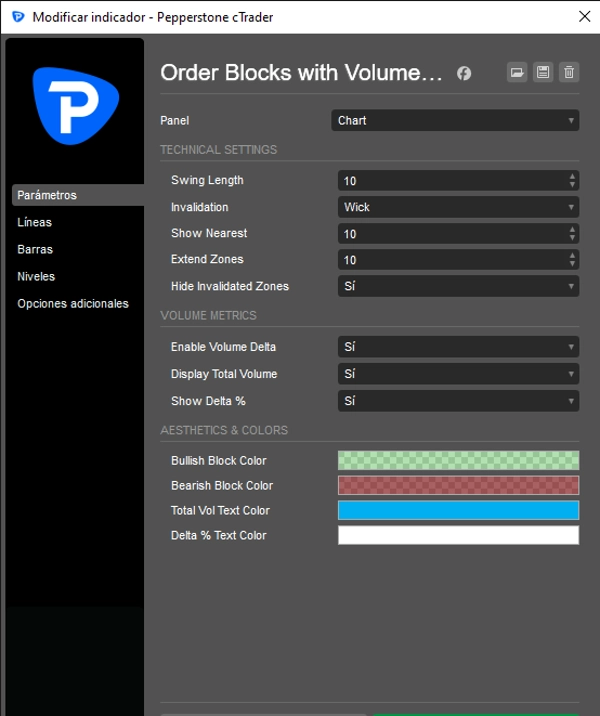
Konfiguracja krok po kroku ⚙️
- Długość swingu: Dostosuj czułość struktury (zalecana wartość: 10).
- Unieważnienie: Wybierz Knot lub Zamknięcie świecy, aby określić ważność strefy.
- Metryki wolumenu: Włącz "Wyświetl całkowity wolumen", aby wizualizować siłę instytucjonalną w czasie rzeczywistym.
Wersja próbna ⏳
- 🔓 Pełne funkcje: Wersja próbna zawiera wszystkie narzędzia obliczeniowe do pełnej oceny.
- 🕒 Czas trwania: Ta wersja demo będzie aktywna przez okres 7 dni.
- 🏢 Ograniczenie konta: Ograniczona wyłącznie do kont demo do celów testowych i ćwiczeniowych.
Podsumowanie
Profil wskaźnika
Opinie klientów
5.0
Opinie: 1
5 | 100 % | |
4 | 0 % | |
3 | 0 % | |
2 | 0 % | |
1 | 0 % |
Opinie klientów
March 27, 2026
The signal still needs a chart check, no surprise there. Overconfidence is the real danger.
Dyskusja
Częste pytania
Forex
Indices
Commodities
Fair Value Gap
SMC
Crypto
Produkty dostępne za pośrednictwem cTrader Store, w tym boty handlowe, wskaźniki i wtyczki, dostarczane są przez deweloperów zewnętrznych i udostępniane wyłącznie w celach informacyjnych oraz w celu zapewnienia dostępu technicznego. cTrader Store nie jest brokerem i nie zapewnia doradztwa inwestycyjnego, nie udziela spersonalizowanych rekomendacji ani nie gwarantuje przyszłych wyników.


Cena
Od 05/05/2025
7
Sprzedaż